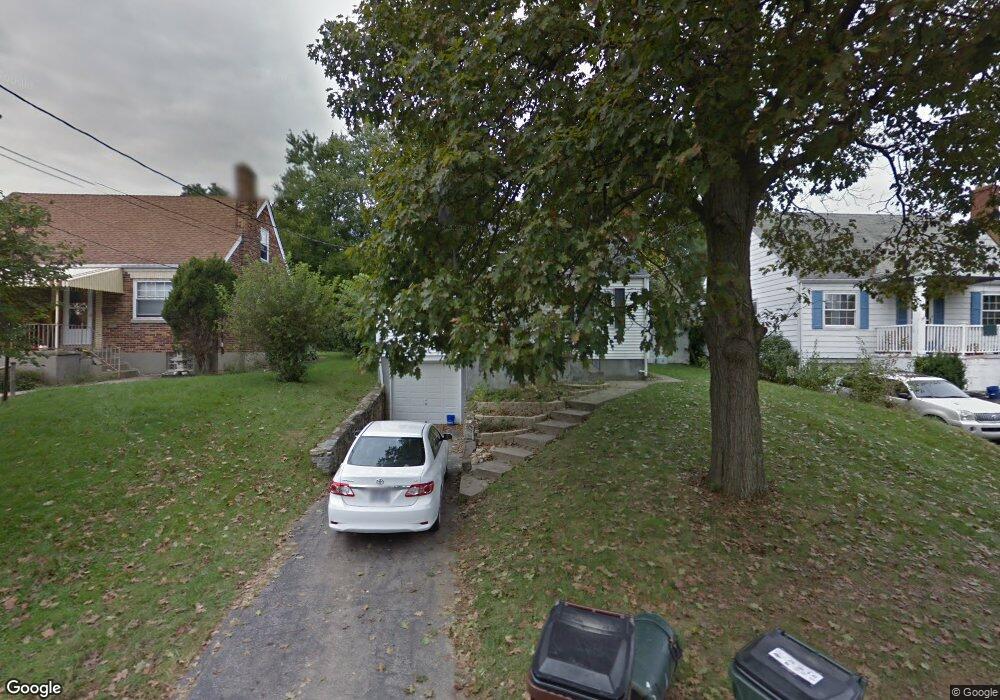
3905 Florence Ave Cincinnati, OH 45248
Estimated Value: $203,000 - $218,000
4
Beds
2
Baths
1,431
Sq Ft
$149/Sq Ft
Est. Value
About This Home
This home is located at 3905 Florence Ave, Cincinnati, OH 45248 and is currently estimated at $213,335, approximately $149 per square foot. 3905 Florence Ave is a home located in Hamilton County with nearby schools including Oakdale Elementary School, Bridgetown Middle School, and Oak Hills High School.
Ownership History
Date
Name
Owned For
Owner Type
Purchase Details
Closed on
May 29, 2024
Sold by
Dws Florence Llc
Bought by
A & A Ultimate Llc
Current Estimated Value
Purchase Details
Closed on
Nov 18, 2010
Sold by
Fannie Mae
Bought by
Smith Darryl
Purchase Details
Closed on
Apr 13, 2010
Sold by
Barnes Megan E
Bought by
Federal National Mortgage Association
Purchase Details
Closed on
May 5, 2006
Sold by
Wurzelbacher Joseph A and Wurzelbacher Mary Ann
Bought by
Barnes Megan E
Home Financials for this Owner
Home Financials are based on the most recent Mortgage that was taken out on this home.
Original Mortgage
$96,999
Interest Rate
6.54%
Mortgage Type
Fannie Mae Freddie Mac
Purchase Details
Closed on
Sep 30, 2005
Sold by
Brown Elizabeth Ann
Bought by
Wurzelbacher Joseph A
Create a Home Valuation Report for This Property
The Home Valuation Report is an in-depth analysis detailing your home's value as well as a comparison with similar homes in the area
Home Values in the Area
Average Home Value in this Area
Purchase History
| Date | Buyer | Sale Price | Title Company |
|---|---|---|---|
| A & A Ultimate Llc | $70,000 | None Listed On Document | |
| Dws Florence Llc | -- | None Listed On Document | |
| Smith Darryl | $35,700 | Accutitle Agency Inc | |
| Federal National Mortgage Association | $60,000 | None Available | |
| Barnes Megan E | $122,000 | None Available | |
| Wurzelbacher Joseph A | $67,000 | None Available |
Source: Public Records
Mortgage History
| Date | Status | Borrower | Loan Amount |
|---|---|---|---|
| Previous Owner | Barnes Megan E | $96,999 |
Source: Public Records
Tax History Compared to Growth
Tax History
| Year | Tax Paid | Tax Assessment Tax Assessment Total Assessment is a certain percentage of the fair market value that is determined by local assessors to be the total taxable value of land and additions on the property. | Land | Improvement |
|---|---|---|---|---|
| 2024 | $2,848 | $53,239 | $8,348 | $44,891 |
| 2023 | $2,800 | $53,239 | $8,348 | $44,891 |
| 2022 | $2,299 | $37,171 | $7,501 | $29,670 |
| 2021 | $2,112 | $37,171 | $7,501 | $29,670 |
| 2020 | $2,087 | $37,171 | $7,501 | $29,670 |
| 2019 | $2,052 | $33,188 | $6,696 | $26,492 |
| 2018 | $2,054 | $33,188 | $6,696 | $26,492 |
| 2017 | $1,962 | $33,188 | $6,696 | $26,492 |
| 2016 | $746 | $12,373 | $7,018 | $5,355 |
| 2015 | $743 | $12,373 | $7,018 | $5,355 |
| 2014 | $743 | $12,373 | $7,018 | $5,355 |
| 2013 | $702 | $12,496 | $7,088 | $5,408 |
Source: Public Records
Map
Nearby Homes
- 5658 Bridgetown Rd
- 5696 Bridgetown Rd Unit 13
- 3936 Janett Ave
- 4419 Grove Ave
- 4341 Regency Ridge Ct
- 3655 Frondorf Ave
- 3668 Castlewood Ln
- 3963 School Section Rd
- 5696 Biscayne Ave
- 4163 Harrison Ave
- 5719 Biscayne Ave
- 5636 Ohio Trail
- 5640 Ohio Trail
- 5648 Ohio Trail
- 5682 Ohio Trail
- Cheswicke Plan at Trailside Village - Classic Series
- Serenity Plan at Trailside Village - Classic Series
- Cooke Plan at Trailside Village - Classic Series
- Hyde Park Plan at Trailside Village - Classic Series
- Covedale Plan at Trailside Village - Neo Traditional
- 3901 Florence Ave
- 3909 Florence Ave
- 3897 Florence Ave
- 3920 Gary Ct
- 3924 Gary Ct
- 3916 Gary Ct
- 3893 Florence Ave
- 3912 Gary Ct
- 3920 Drew Ave
- 3916 Drew Ave
- 3912 Florence Ave
- 3904 Florence Ave
- 3887 Florence Ave
- 3924 Drew Ave
- 3916 Florence Ave
- 3906 Gary Ct
- 3900 Florence Ave
- 3928 Drew Ave
- 3883 Florence Ave
- 5520 Marie Ave