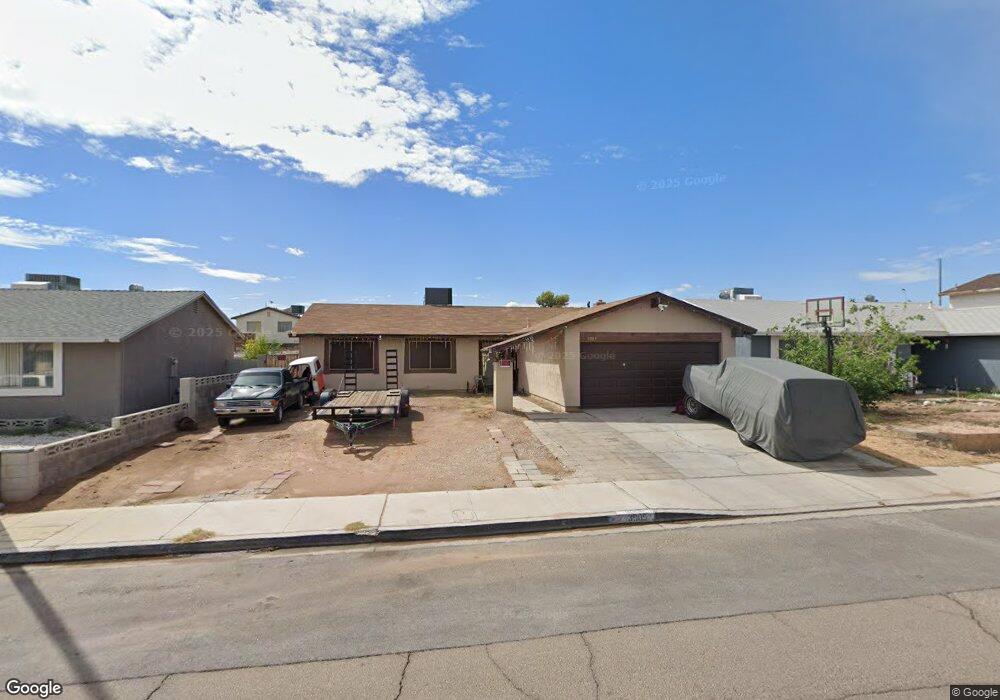
3905 Manford Cir Las Vegas, NV 89104
Estimated Value: $335,689 - $378,000
4
Beds
2
Baths
1,358
Sq Ft
$266/Sq Ft
Est. Value
About This Home
This home is located at 3905 Manford Cir, Las Vegas, NV 89104 and is currently estimated at $361,672, approximately $266 per square foot. 3905 Manford Cir is a home located in Clark County with nearby schools including Walter V. Long Elementary School, Jerome Mack Middle School, and Desert Pines High School.
Ownership History
Date
Name
Owned For
Owner Type
Purchase Details
Closed on
Feb 27, 2019
Sold by
Lamothe Richard and Lamothe Kimberly
Bought by
Lamothe Kimberly
Current Estimated Value
Home Financials for this Owner
Home Financials are based on the most recent Mortgage that was taken out on this home.
Original Mortgage
$141,190
Interest Rate
4.3%
Mortgage Type
New Conventional
Purchase Details
Closed on
Aug 28, 2007
Sold by
Jones Jackie
Bought by
Jones Thomas Garfield
Home Financials for this Owner
Home Financials are based on the most recent Mortgage that was taken out on this home.
Original Mortgage
$149,500
Interest Rate
6.67%
Mortgage Type
New Conventional
Create a Home Valuation Report for This Property
The Home Valuation Report is an in-depth analysis detailing your home's value as well as a comparison with similar homes in the area
Home Values in the Area
Average Home Value in this Area
Purchase History
| Date | Buyer | Sale Price | Title Company |
|---|---|---|---|
| Lamothe Kimberly | -- | Boston National Title Age | |
| Jones Jacqueline L | -- | Boston National Title Age | |
| Jones Thomas Garfield | -- | Commonwealth Title | |
| Jones Thomas Garfield | -- | Accommodation |
Source: Public Records
Mortgage History
| Date | Status | Borrower | Loan Amount |
|---|---|---|---|
| Closed | Lamothe Kimberly | $141,190 | |
| Closed | Jones Thomas Garfield | $149,500 |
Source: Public Records
Tax History Compared to Growth
Tax History
| Year | Tax Paid | Tax Assessment Tax Assessment Total Assessment is a certain percentage of the fair market value that is determined by local assessors to be the total taxable value of land and additions on the property. | Land | Improvement |
|---|---|---|---|---|
| 2025 | $727 | $46,414 | $27,300 | $19,114 |
| 2024 | $706 | $46,414 | $27,300 | $19,114 |
| 2023 | $540 | $48,028 | $29,750 | $18,278 |
| 2022 | $751 | $41,738 | $24,500 | $17,238 |
| 2021 | $696 | $37,890 | $21,000 | $16,890 |
| 2020 | $643 | $37,904 | $20,650 | $17,254 |
| 2019 | $603 | $36,726 | $19,250 | $17,476 |
| 2018 | $575 | $32,900 | $15,750 | $17,150 |
| 2017 | $931 | $31,739 | $14,000 | $17,739 |
| 2016 | $540 | $28,804 | $10,150 | $18,654 |
| 2015 | $538 | $24,805 | $7,700 | $17,105 |
| 2014 | $522 | $19,541 | $5,600 | $13,941 |
Source: Public Records
Map
Nearby Homes
- 3887 Delling Ct
- 4055 E New York Ave
- 1944 Randa Ln
- 1601 S Sandhill Rd Unit 78
- 1601 S Sandhill Rd Unit 191
- 4057 Olive St
- 1892 Miner Way
- 4067 E Colorado Ave
- 3724 Lanai Ave
- 2356 Grannis Ln
- 4170 E Baltimore Ave
- 4214 E Baltimore Ave
- 2278 Miner Way
- 1624 Palm St Unit 159
- 1624 Palm St Unit 220
- 1624 Palm St Unit 237
- 1624 Palm St Unit 246
- 1624 Palm St Unit 154
- 1624 Palm St Unit 175
- 1624 Palm St Unit 85
- 3915 Manford Cir
- 3897 Manford Cir
- 3904 E Wyoming Ave
- 3925 Manford Cir
- 3914 E Wyoming Ave
- 3887 Manford Cir
- 3896 E Wyoming Ave
- 3924 E Wyoming Ave
- 3904 Manford Cir
- 3914 Manford Cir
- 3886 E Wyoming Ave
- 3896 Manford Cir
- 3933 Manford Cir
- 3924 Manford Cir
- 3932 E Wyoming Ave
- 3888 Manford Cir
- 3876 E Wyoming Ave
- 3943 Manford Cir
- 3932 Manford Cir
- 3942 E Wyoming Ave