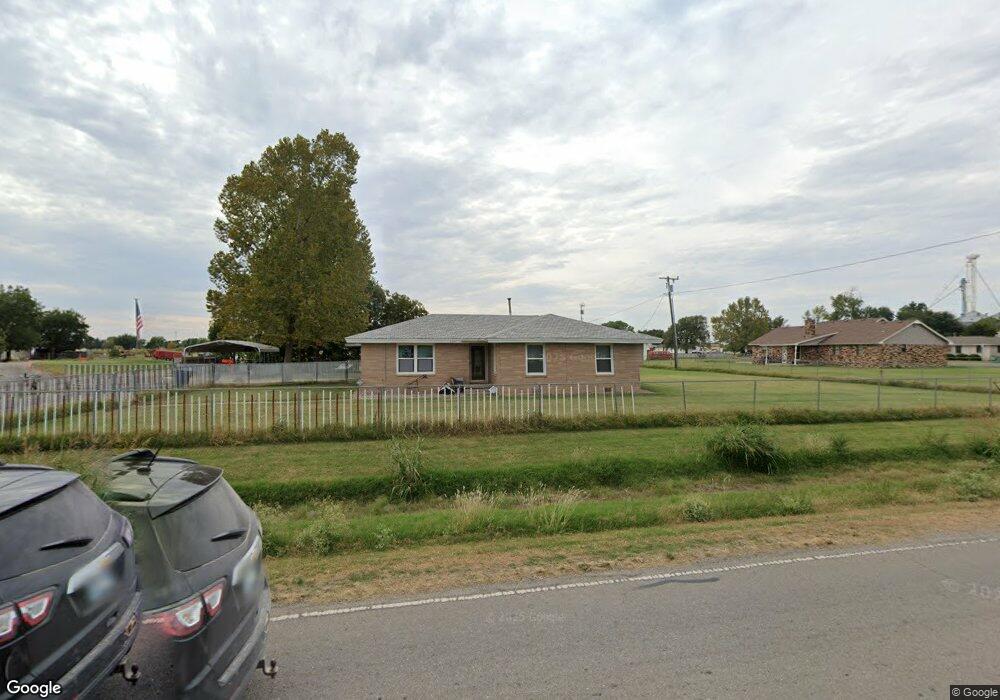
3905 N Banner Rd El Reno, OK 73036
Estimated Value: $134,000 - $259,000
3
Beds
2
Baths
1,442
Sq Ft
$130/Sq Ft
Est. Value
About This Home
This home is located at 3905 N Banner Rd, El Reno, OK 73036 and is currently estimated at $186,876, approximately $129 per square foot. 3905 N Banner Rd is a home located in Canadian County with nearby schools including Banner School.
Ownership History
Date
Name
Owned For
Owner Type
Purchase Details
Closed on
Apr 23, 2018
Sold by
Feldmeier Mark A
Bought by
Feldmeier Kezia and Feldmeier Mark
Current Estimated Value
Purchase Details
Closed on
Jun 28, 2005
Sold by
Wells Philip A and Wells Naomi
Bought by
Feldmeier Mark Arian
Home Financials for this Owner
Home Financials are based on the most recent Mortgage that was taken out on this home.
Original Mortgage
$98,064
Interest Rate
5.67%
Mortgage Type
VA
Purchase Details
Closed on
Nov 5, 1999
Sold by
Davis Floyd and Davis Verona M
Purchase Details
Closed on
May 7, 1996
Sold by
Fountain Charles and Fountain Rachel
Purchase Details
Closed on
Oct 23, 1995
Sold by
Selement Curtis
Purchase Details
Closed on
Oct 20, 1995
Sold by
Selement Leslie
Purchase Details
Closed on
Oct 19, 1995
Sold by
Covington Gayle and Covington Roy
Purchase Details
Closed on
Jul 7, 1992
Purchase Details
Closed on
Jul 23, 1991
Create a Home Valuation Report for This Property
The Home Valuation Report is an in-depth analysis detailing your home's value as well as a comparison with similar homes in the area
Home Values in the Area
Average Home Value in this Area
Purchase History
| Date | Buyer | Sale Price | Title Company |
|---|---|---|---|
| Feldmeier Kezia | -- | None Available | |
| Feldmeier Mark Arian | $72,000 | None Available | |
| -- | $65,000 | -- | |
| -- | $60,000 | -- | |
| -- | $4,700 | -- | |
| -- | $4,700 | -- | |
| -- | $9,300 | -- | |
| -- | $2,300 | -- | |
| -- | -- | -- | |
| -- | -- | -- |
Source: Public Records
Mortgage History
| Date | Status | Borrower | Loan Amount |
|---|---|---|---|
| Previous Owner | Feldmeier Mark Arian | $98,064 |
Source: Public Records
Tax History Compared to Growth
Tax History
| Year | Tax Paid | Tax Assessment Tax Assessment Total Assessment is a certain percentage of the fair market value that is determined by local assessors to be the total taxable value of land and additions on the property. | Land | Improvement |
|---|---|---|---|---|
| 2024 | $894 | $13,105 | $600 | $12,505 |
| 2023 | $894 | $12,724 | $600 | $12,124 |
| 2022 | $874 | $12,353 | $600 | $11,753 |
| 2021 | $850 | $11,993 | $600 | $11,393 |
| 2020 | $832 | $11,887 | $600 | $11,287 |
| 2019 | $810 | $11,541 | $600 | $10,941 |
| 2018 | $796 | $11,205 | $600 | $10,605 |
| 2017 | $809 | $11,295 | $600 | $10,695 |
| 2016 | $768 | $11,198 | $600 | $10,598 |
| 2015 | $712 | $10,646 | $600 | $10,046 |
| 2014 | $712 | $10,646 | $600 | $10,046 |
Source: Public Records
Map
Nearby Homes
- 11020 N Banner Rd
- 3501 Manning Farms Blvd
- 4160 N Gregory Rd
- 8592 Beth Ln
- 8652 Beth Ln
- 4115 S Manning Rd
- 8664 Rip Way
- 8384 Rip Way
- 8634 Rip Way
- 8604 Rip Way
- 8454 Rip Way
- 8574 Rip Way
- 7145 S Manning Rd
- 4747 Dutton Cir
- 8626 Kayce St
- 8545 Kayce St
- 8625 Kayce St
- 8655 Kayce St
- 8595 Kayce St
- 3550 N Manning Rd
- 3905 N Banner Rd
- 3855 N Banner Rd
- 17032 Darren Ave
- 17021 Darren Ave
- 17064 Darren Ave
- 17043 Darren Ave
- 3805 N Banner Rd
- 17088 Darren Ave
- 4065 N Banner Rd
- 17067 Darren Ave
- 17048 White St
- 17103 Darren Ave
- 5 N Banner Rd
- 4076 N Banner Rd
- 17127 Darren Ave
- 17051 White St
- 4115 N Banner Rd
- 17164 Darren Ave
- 17143 Darren Ave
- 4123 N Banner Rd