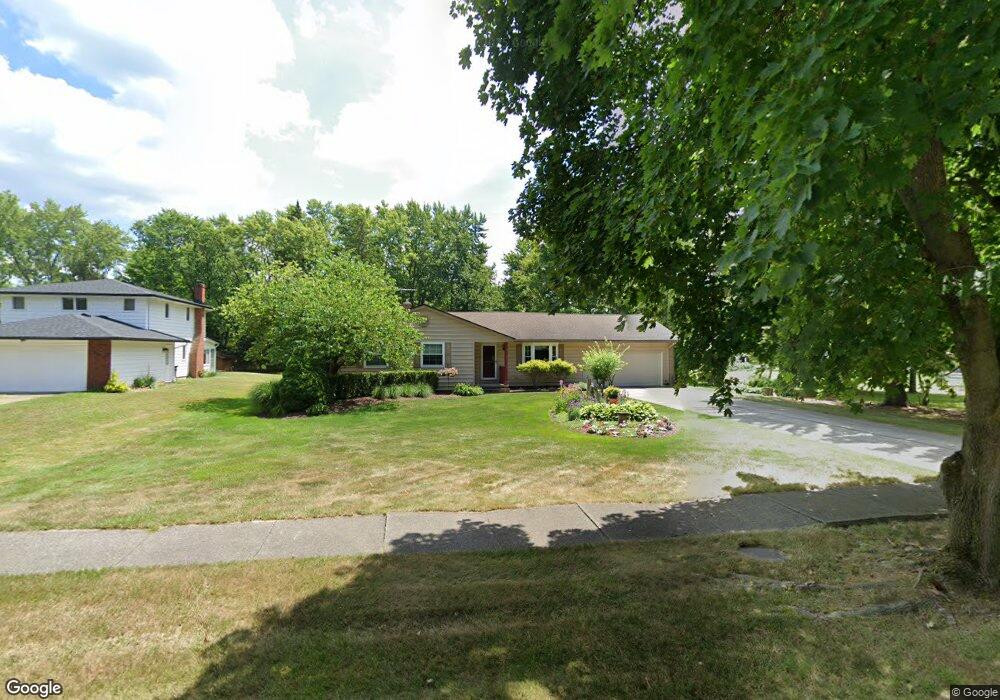
3905 Russett Dr Broadview Heights, OH 44147
Estimated Value: $317,998 - $348,000
3
Beds
2
Baths
1,597
Sq Ft
$212/Sq Ft
Est. Value
About This Home
This home is located at 3905 Russett Dr, Broadview Heights, OH 44147 and is currently estimated at $338,500, approximately $211 per square foot. 3905 Russett Dr is a home located in Cuyahoga County with nearby schools including Brecksville-Broadview Heights Middle School, Brecksville-Broadview Heights High School, and Assumption Academy.
Ownership History
Date
Name
Owned For
Owner Type
Purchase Details
Closed on
Aug 31, 2000
Sold by
Armstrong Paul A
Bought by
Harvan Paul J and Harvan Nancy L
Current Estimated Value
Home Financials for this Owner
Home Financials are based on the most recent Mortgage that was taken out on this home.
Original Mortgage
$25,000
Interest Rate
8.15%
Purchase Details
Closed on
Jun 22, 1995
Sold by
Little David W
Bought by
Paul A Armstrong
Home Financials for this Owner
Home Financials are based on the most recent Mortgage that was taken out on this home.
Original Mortgage
$80,000
Interest Rate
7.9%
Mortgage Type
New Conventional
Purchase Details
Closed on
Jul 30, 1992
Sold by
Gliha Evelyn M
Bought by
Little David W
Purchase Details
Closed on
Jul 9, 1987
Sold by
Gliha Evelyn M and Gliha Stanley J
Bought by
Gliha Evelyn M
Purchase Details
Closed on
Jan 1, 1975
Bought by
Gliha Evelyn M and Gliha Stanley J
Create a Home Valuation Report for This Property
The Home Valuation Report is an in-depth analysis detailing your home's value as well as a comparison with similar homes in the area
Home Values in the Area
Average Home Value in this Area
Purchase History
| Date | Buyer | Sale Price | Title Company |
|---|---|---|---|
| Harvan Paul J | $184,000 | Quality Title Agency Inc | |
| Paul A Armstrong | $141,500 | -- | |
| Little David W | $126,200 | -- | |
| Gliha Evelyn M | -- | -- | |
| Gliha Evelyn M | -- | -- |
Source: Public Records
Mortgage History
| Date | Status | Borrower | Loan Amount |
|---|---|---|---|
| Closed | Harvan Paul J | $25,000 | |
| Closed | Paul A Armstrong | $80,000 |
Source: Public Records
Tax History Compared to Growth
Tax History
| Year | Tax Paid | Tax Assessment Tax Assessment Total Assessment is a certain percentage of the fair market value that is determined by local assessors to be the total taxable value of land and additions on the property. | Land | Improvement |
|---|---|---|---|---|
| 2024 | $4,853 | $96,075 | $21,350 | $74,725 |
| 2023 | $4,576 | $77,880 | $21,350 | $56,530 |
| 2022 | $4,578 | $77,880 | $21,350 | $56,530 |
| 2021 | $4,537 | $77,880 | $21,350 | $56,530 |
| 2020 | $4,022 | $63,840 | $17,500 | $46,340 |
| 2019 | $3,890 | $182,400 | $50,000 | $132,400 |
| 2018 | $3,686 | $63,840 | $17,500 | $46,340 |
| 2017 | $3,842 | $60,310 | $14,530 | $45,780 |
| 2016 | $3,508 | $60,310 | $14,530 | $45,780 |
| 2015 | $3,384 | $60,310 | $14,530 | $45,780 |
| 2014 | $3,384 | $58,560 | $14,110 | $44,450 |
Source: Public Records
Map
Nearby Homes
- 4125 Ryeland Dr
- 3785 Russett Dr
- 3370 Harris Rd
- 4842 Lincolnshire Ct
- 8801 Glen Hallow
- 1471 Summerwood Dr
- 6522 Mill Rd
- 9200 Windswept Dr
- 1040 Hunters Trail
- 8851 Spring Valley Dr
- 4926 E Wallings Rd
- 6753 Mill Rd
- 6684 Farview Rd
- 1345 E Royalton Rd
- 6767 Old Royalton Rd Unit 4
- 6826 Old Royalton Rd Unit 2
- 6713 Farview Rd
- 2302 Stoney Run Trail Unit 2302
- 8471 Broadview Rd
- 6920 Carriage Hill Dr
- 3895 Russett Dr
- 3885 Russett Dr
- 4041 Harris Rd
- 4121 Harris Rd
- 3941 Harris Rd
- 3900 Russett Dr
- 4200 Ryeland Dr
- 3865 Russett Dr
- 3891 Harris Rd
- 3880 Russett Dr
- 4280 Ryeland Dr
- 4225 Harris Rd
- 3860 Russett Dr
- 4360 Ryeland Dr
- 3841 Harris Rd
- 4320 Meadow Gateway
- 3980 Harris Rd
- 4360 Meadow Gateway
- 4331 Harris Rd
- 4270 Meadow Gateway