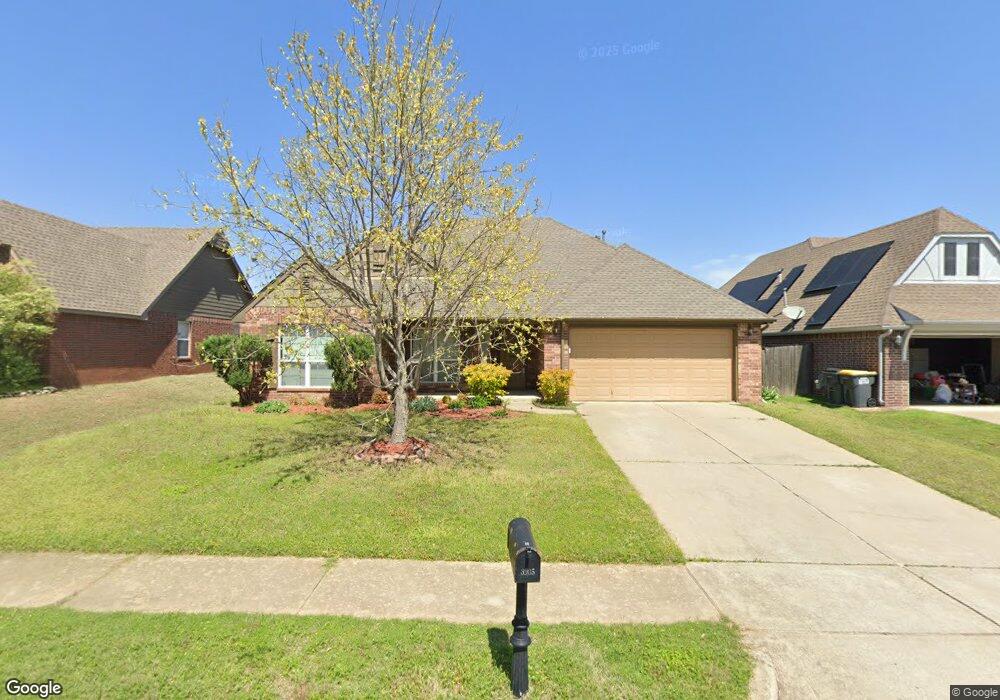
3905 W 110th Place S Sapulpa, OK 74066
Estimated Value: $290,000 - $333,000
3
Beds
2
Baths
1,690
Sq Ft
$180/Sq Ft
Est. Value
About This Home
This home is located at 3905 W 110th Place S, Sapulpa, OK 74066 and is currently estimated at $303,657, approximately $179 per square foot. 3905 W 110th Place S is a home located in Tulsa County with nearby schools including Jenks West Elementary School, Jenks West Intermediate Elementary School, and Jenks Middle School.
Ownership History
Date
Name
Owned For
Owner Type
Purchase Details
Closed on
Oct 11, 2011
Sold by
Kirchner Tyler W and Kirchner Tracy L
Bought by
Herath Gayan Dileepa and Gunasena Dilani Nilushika
Current Estimated Value
Home Financials for this Owner
Home Financials are based on the most recent Mortgage that was taken out on this home.
Original Mortgage
$165,855
Outstanding Balance
$113,283
Interest Rate
4.13%
Mortgage Type
New Conventional
Estimated Equity
$190,374
Purchase Details
Closed on
Dec 17, 2009
Sold by
Korets Tatyana and Korets Rostislav
Bought by
Kirchner Tyler W and Kirchner Tracy L
Purchase Details
Closed on
Feb 23, 2007
Sold by
Simmons Homes Residential Group Llc
Bought by
Korets Tatyana
Home Financials for this Owner
Home Financials are based on the most recent Mortgage that was taken out on this home.
Original Mortgage
$130,672
Interest Rate
6.21%
Mortgage Type
Purchase Money Mortgage
Create a Home Valuation Report for This Property
The Home Valuation Report is an in-depth analysis detailing your home's value as well as a comparison with similar homes in the area
Home Values in the Area
Average Home Value in this Area
Tax History Compared to Growth
Map
Nearby Homes
- 10910 S Olmsted St
- 3710 W 110th St S
- 3706 W 106th St S
- 10732 S 33rd West Ave
- 10417 S 33rd West Ave
- 11602 S 30th West Ave
- 11608 S Union Ave
- 10317 S Nathan St
- 2957 W 114th Place S
- 11275 S Douglas Ave
- 11009 Augusta Dr
- 10739 Masters Cir
- 2629 W 115th St S
- 11710 S Willow Place
- 11728 S Willow Place
- 2012 W 109th St S
- 0 Lakeside Dr
- 11206 S Redbud St
- 4367 Lakeside Dr
- 12108 S Elm St
- 3907 W 110th Place S
- 3911 W 110th Place S
- 3913 W 110th Place S
- 3903 W 110th Place S
- 3904 W 110th Place S
- 3906 W 110th Place S
- 3912 W 110th Place S
- 3914 W 110th Place S
- 3909 W 110th Place S
- 11009 S Nathan St
- 11011 S Nathan St
- 11007 S Nathan St
- 3902 W 110th Place S
- 3908 W 110th St S
- 3906 W 110th St S
- 3908 W 110th St S
- 3910 W 110th St S
- 3904 W 110th St S
- 3912 W 110th St S
- 3914 W 110th St S