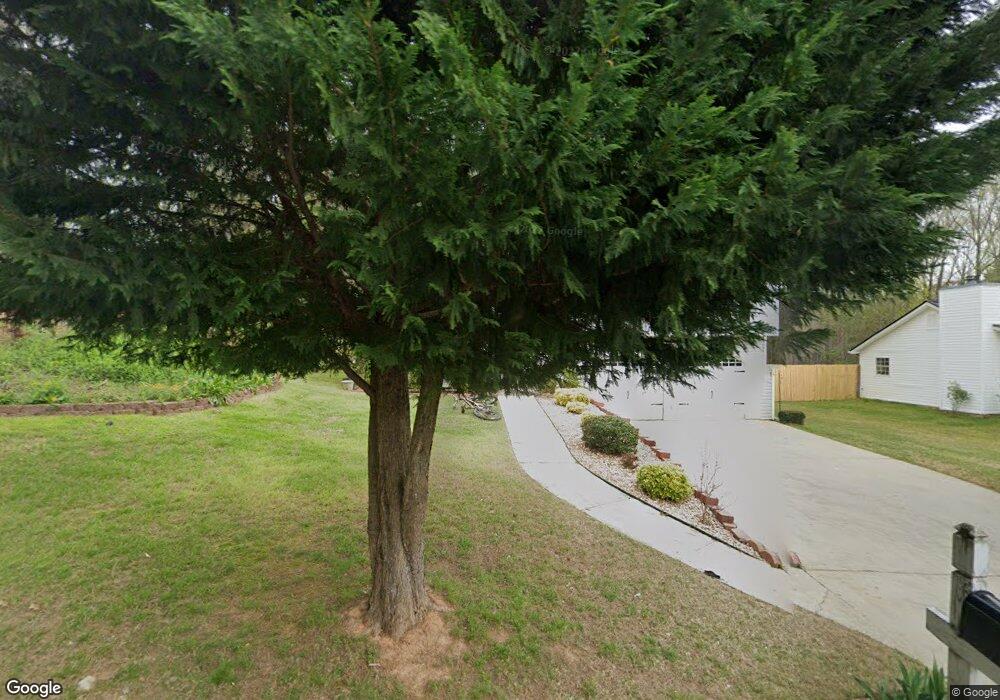
3906 Deaton Rd Unit 22 Flowery Branch, GA 30542
Estimated Value: $313,584 - $357,000
4
Beds
2
Baths
1,248
Sq Ft
$273/Sq Ft
Est. Value
About This Home
This home is located at 3906 Deaton Rd Unit 22, Flowery Branch, GA 30542 and is currently estimated at $340,896, approximately $273 per square foot. 3906 Deaton Rd Unit 22 is a home located in Hall County with nearby schools including Martin Elementary School, Southwest Middle School, and C.W. Davis Middle School.
Ownership History
Date
Name
Owned For
Owner Type
Purchase Details
Closed on
Sep 2, 2021
Sold by
Dechavez Gloria A Rodriguez
Bought by
Chavez Eliam
Current Estimated Value
Purchase Details
Closed on
Apr 21, 2017
Sold by
Mejia Raul Velasquez
Bought by
Rodriguez De Chavez and Rodriguez Gloria A
Purchase Details
Closed on
Dec 2, 2013
Sold by
Chavez Dario
Bought by
Mejia Raul Velasquez
Purchase Details
Closed on
Jan 7, 2013
Sold by
Chavez Samuel
Bought by
Chavez Dario
Purchase Details
Closed on
Dec 21, 2010
Sold by
Chavez Samuel
Bought by
Chavez Dario
Purchase Details
Closed on
Sep 25, 2006
Sold by
Abdi Troy and Abdi Tina M
Bought by
Chavez Dario and Chavez Samuel
Home Financials for this Owner
Home Financials are based on the most recent Mortgage that was taken out on this home.
Original Mortgage
$138,901
Interest Rate
6.36%
Mortgage Type
FHA
Purchase Details
Closed on
Jul 19, 1996
Sold by
Reed Bldrs Inc
Bought by
Abdi Troy Tina M
Create a Home Valuation Report for This Property
The Home Valuation Report is an in-depth analysis detailing your home's value as well as a comparison with similar homes in the area
Home Values in the Area
Average Home Value in this Area
Purchase History
| Date | Buyer | Sale Price | Title Company |
|---|---|---|---|
| Chavez Eliam | -- | -- | |
| Rodriguez De Chavez | -- | -- | |
| Mejia Raul Velasquez | $64,000 | -- | |
| Chavez Dario | -- | -- | |
| Chavez Dario | -- | -- | |
| Chavez Dario | $140,000 | -- | |
| Abdi Troy Tina M | $87,900 | -- |
Source: Public Records
Mortgage History
| Date | Status | Borrower | Loan Amount |
|---|---|---|---|
| Previous Owner | Chavez Dario | $138,901 | |
| Closed | Abdi Troy Tina M | $0 |
Source: Public Records
Tax History Compared to Growth
Tax History
| Year | Tax Paid | Tax Assessment Tax Assessment Total Assessment is a certain percentage of the fair market value that is determined by local assessors to be the total taxable value of land and additions on the property. | Land | Improvement |
|---|---|---|---|---|
| 2024 | $3,059 | $118,880 | $18,720 | $100,160 |
| 2023 | $2,796 | $108,080 | $15,600 | $92,480 |
| 2022 | $2,651 | $98,120 | $17,680 | $80,440 |
| 2021 | $2,267 | $81,640 | $8,320 | $73,320 |
| 2020 | $1,929 | $66,760 | $8,320 | $58,440 |
| 2019 | $1,789 | $61,040 | $10,280 | $50,760 |
| 2018 | $1,615 | $52,880 | $10,280 | $42,600 |
| 2017 | $1,406 | $48,000 | $10,280 | $37,720 |
| 2016 | $1,240 | $43,040 | $7,160 | $35,880 |
| 2015 | $769 | $27,574 | $6,120 | $21,454 |
| 2014 | $769 | $27,574 | $6,120 | $21,454 |
Source: Public Records
Map
Nearby Homes
- 4086 Parks Rd
- 3929 Perry Ln
- 4684 Martins Crossing Dr W
- 4020 Parks Rd
- 4838 Netherlands Place
- 4743 Amsterdam Ln
- 3582 Winder Hwy
- 3617 Winder Hwy
- 4708 Upper Berkshire Rd Unit 39
- 4021 Laurant Path
- 4013 Laurant Path
- 4016 Laurant Path
- 4054 Alderstone Dr
- 4042 Alderstone Dr
- 4050 Alderstone Dr
- Wakehurst Plan at Falls Creek
- 3935 Alderstone Dr
- Sheridan Plan at Falls Creek
- Avera Plan at Falls Creek
- 3906 Deaton Rd
- 3902 Deaton Rd
- 3970 Rock Haven Dr
- 3896 Deaton Rd
- 3904 Wakefield Dr
- 3974 Rock Haven Dr
- 3929 Edgebrook Dr
- 3892 Deaton Rd
- 3908 Wakefield Dr
- 3933 Edgebrook Dr
- 3903 Wakefield Dr
- 3978 Rock Haven Dr
- 3916 Deaton Rd
- 3971 Rock Haven Dr
- 3912 Wakefield Dr
- 3907 Wakefield Dr
- 3937 Edgebrook Dr
- 3930 Edgebrook Dr
- 3979 Rock Haven Dr
- 3975 Rock Haven Dr