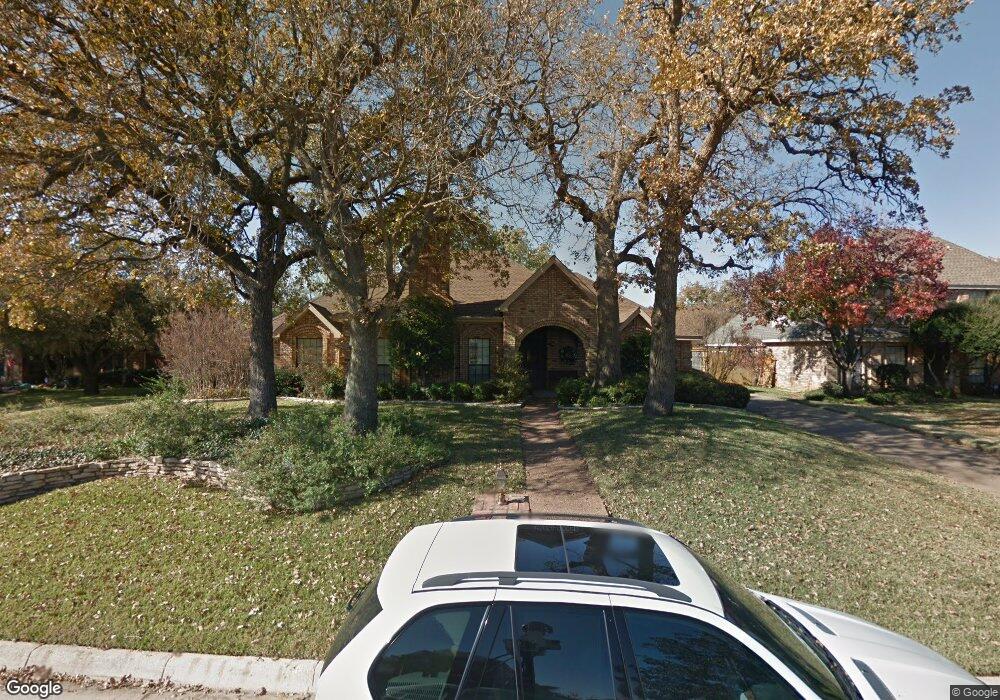
3906 Magnolia Ct Colleyville, TX 76034
Estimated Value: $683,000 - $764,000
4
Beds
3
Baths
2,895
Sq Ft
$248/Sq Ft
Est. Value
About This Home
This home is located at 3906 Magnolia Ct, Colleyville, TX 76034 and is currently estimated at $718,363, approximately $248 per square foot. 3906 Magnolia Ct is a home located in Tarrant County with nearby schools including Bedford Heights Elementary School, Bedford Junior High School, and L.D. Bell High School.
Ownership History
Date
Name
Owned For
Owner Type
Purchase Details
Closed on
Aug 22, 2019
Sold by
Levi Randall C
Bought by
Edwards James E and Edwards Olga C
Current Estimated Value
Home Financials for this Owner
Home Financials are based on the most recent Mortgage that was taken out on this home.
Original Mortgage
$419,000
Outstanding Balance
$366,967
Interest Rate
3.7%
Mortgage Type
VA
Estimated Equity
$351,396
Purchase Details
Closed on
Mar 29, 2017
Sold by
Levi Theresa Ann
Bought by
Levi Randall C
Home Financials for this Owner
Home Financials are based on the most recent Mortgage that was taken out on this home.
Original Mortgage
$250,000
Interest Rate
4.15%
Mortgage Type
New Conventional
Purchase Details
Closed on
May 10, 2005
Sold by
Stansberger Kenneth L and Stansberger Loretta J
Bought by
Levi Randall C and Levi Theresa
Home Financials for this Owner
Home Financials are based on the most recent Mortgage that was taken out on this home.
Original Mortgage
$230,400
Interest Rate
6.03%
Mortgage Type
Purchase Money Mortgage
Create a Home Valuation Report for This Property
The Home Valuation Report is an in-depth analysis detailing your home's value as well as a comparison with similar homes in the area
Home Values in the Area
Average Home Value in this Area
Purchase History
| Date | Buyer | Sale Price | Title Company |
|---|---|---|---|
| Edwards James E | -- | Fatico | |
| Levi Randall C | -- | None Available | |
| Levi Randall C | -- | Stewart Title |
Source: Public Records
Mortgage History
| Date | Status | Borrower | Loan Amount |
|---|---|---|---|
| Open | Edwards James E | $419,000 | |
| Previous Owner | Levi Randall C | $250,000 | |
| Previous Owner | Levi Randall C | $230,400 |
Source: Public Records
Tax History Compared to Growth
Tax History
| Year | Tax Paid | Tax Assessment Tax Assessment Total Assessment is a certain percentage of the fair market value that is determined by local assessors to be the total taxable value of land and additions on the property. | Land | Improvement |
|---|---|---|---|---|
| 2025 | $7,399 | $625,195 | $185,900 | $439,295 |
| 2024 | $7,399 | $625,195 | $185,900 | $439,295 |
| 2023 | $9,570 | $657,011 | $185,900 | $471,111 |
| 2022 | $10,099 | $571,751 | $185,900 | $385,851 |
| 2021 | $9,825 | $493,892 | $111,540 | $382,352 |
| 2020 | $9,036 | $427,152 | $111,540 | $315,612 |
| 2019 | $8,808 | $413,383 | $111,540 | $301,843 |
| 2018 | $6,451 | $365,906 | $111,540 | $254,366 |
| 2017 | $8,886 | $389,451 | $80,000 | $309,451 |
| 2016 | $8,410 | $368,557 | $80,000 | $288,557 |
| 2015 | $7,149 | $387,788 | $60,000 | $327,788 |
| 2014 | $7,149 | $325,200 | $50,000 | $275,200 |
Source: Public Records
Map
Nearby Homes
- 1303 Crest Dr
- 1421 Plantation Dr N
- 3907 Copperwood Ct
- 4002 Copperwood Ct
- 1136 Wingate Dr
- 3827 Ashbury Ln
- 3907 Windermere Dr
- 1109 Simpson Terrace
- 1209 Hillandale Ct
- 2001 Oak Knoll Dr
- 4105 Inwood Ln
- 1820 Wimbleton Dr
- 3301 Wendover Ct
- 2204 Woodstock Dr
- 3624 Wayne Ct
- 4600 Stafford Dr
- 1800 Hampton Dr
- 909 Brestol Ct W
- 4516 Dartmoore Ln
- 3609 Wayne Ct
- 3908 Magnolia Ct
- 3904 Magnolia Ct
- 4002 Magnolia Ct
- 4001 Tara Dr
- 4003 Tara Dr
- 3902 Magnolia Ct
- 3903 Magnolia Ct
- 3905 Tara Dr
- 3905 Magnolia Ct
- 3900 Magnolia Ct
- 4005 Tara Dr
- 4001 Magnolia Ct
- 3901 Magnolia Ct
- 3901 Tara Dr
- 4003 Magnolia Ct
- 1304 Plantation Dr S
- 3904 Ashley Ct
- 1302 Plantation Dr S
- 3906 Ashley Ct
- 1306 Plantation Dr S