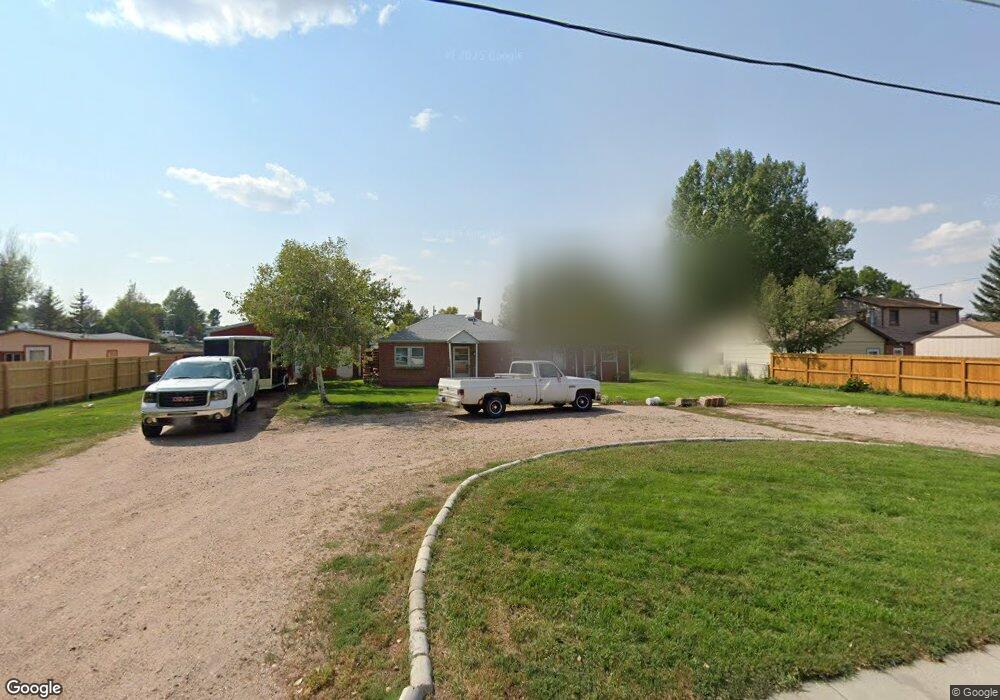
3906 Monroe Ave Cheyenne, WY 82001
Estimated Value: $274,428 - $289,000
--
Bed
--
Bath
1,200
Sq Ft
$237/Sq Ft
Est. Value
About This Home
This home is located at 3906 Monroe Ave, Cheyenne, WY 82001 and is currently estimated at $284,107, approximately $236 per square foot. 3906 Monroe Ave is a home with nearby schools including Baggs Elementary School, Carey Junior High School, and East High School.
Ownership History
Date
Name
Owned For
Owner Type
Purchase Details
Closed on
Jan 18, 2005
Sold by
Clark William E
Bought by
Clark William E
Current Estimated Value
Home Financials for this Owner
Home Financials are based on the most recent Mortgage that was taken out on this home.
Original Mortgage
$63,700
Interest Rate
5.8%
Mortgage Type
New Conventional
Purchase Details
Closed on
Mar 8, 1999
Sold by
Albach Murray D
Bought by
Clark William E
Purchase Details
Closed on
Dec 31, 1998
Sold by
Albach Audrey
Bought by
Albach Murray D
Purchase Details
Closed on
Jun 12, 1997
Sold by
Western United Life Assurance Co
Bought by
Albach Murry D and Albach Audrey
Home Financials for this Owner
Home Financials are based on the most recent Mortgage that was taken out on this home.
Original Mortgage
$63,700
Interest Rate
5.8%
Mortgage Type
New Conventional
Create a Home Valuation Report for This Property
The Home Valuation Report is an in-depth analysis detailing your home's value as well as a comparison with similar homes in the area
Home Values in the Area
Average Home Value in this Area
Purchase History
| Date | Buyer | Sale Price | Title Company |
|---|---|---|---|
| Clark William E | -- | -- | |
| Clark William E | -- | -- | |
| Albach Murray D | -- | -- | |
| Albach Murry D | -- | -- |
Source: Public Records
Mortgage History
| Date | Status | Borrower | Loan Amount |
|---|---|---|---|
| Closed | Clark William E | $63,700 | |
| Closed | Clark William E | $63,700 | |
| Previous Owner | Albach Murry D | $63,700 |
Source: Public Records
Tax History Compared to Growth
Tax History
| Year | Tax Paid | Tax Assessment Tax Assessment Total Assessment is a certain percentage of the fair market value that is determined by local assessors to be the total taxable value of land and additions on the property. | Land | Improvement |
|---|---|---|---|---|
| 2025 | $1,417 | $15,282 | $2,674 | $12,608 |
| 2024 | $1,417 | $20,042 | $3,566 | $16,476 |
| 2023 | $1,388 | $19,630 | $3,566 | $16,064 |
| 2022 | $1,227 | $17,005 | $3,566 | $13,439 |
| 2021 | $1,137 | $15,715 | $3,235 | $12,480 |
| 2020 | $1,020 | $14,146 | $3,235 | $10,911 |
| 2019 | $954 | $13,208 | $3,235 | $9,973 |
| 2018 | $906 | $12,664 | $3,235 | $9,429 |
| 2017 | $864 | $11,966 | $3,235 | $8,731 |
| 2016 | $803 | $11,123 | $3,047 | $8,076 |
| 2015 | $795 | $11,002 | $3,047 | $7,955 |
| 2014 | $812 | $11,165 | $3,047 | $8,118 |
Source: Public Records
Map
Nearby Homes
- 4315 Bevans St
- 3711 Rawlins St
- 4112 Gem Trail
- 4547 Rock Springs St
- TBD Rock Springs St
- 4519 Marble Ave
- 4002 Cheyenne St
- 3802 Mccann Ave
- 4518 Ontario Ave
- 3316 Rock Springs St
- 4013 Bradney Ave
- Lot 1 Block 2 N College Dr
- Lot 1 Block 1 N College Dr
- 5001 Sunny Ridge Ln
- 3820 E Pershing Blvd
- 3820 E Pershing Blvd
- 5014 Crews Ct
- 3808 Gregg Way Unit 3
- 4700 Shell Beach Ave
- 4738 Piccadilly Dr
- 3912 Monroe Ave
- 3900 Monroe Ave
- 4119 Rock Springs St
- 4013 Rock Springs St
- 3905 Monroe Ave
- 3911 Monroe Ave
- 3923 Monroe Ave
- 3901 Monroe Ave
- 3812 Monroe Ave
- 3815 N College Dr
- 4003 Rock Springs St
- 3903 N College Dr
- 4203 Hope Ct
- 4120 Rock Springs St
- 4102 Rawlins St
- 4209 Hope Ct
- 4104 Rawlins St
- 4014 Rawlins St
- 4208 Hope Ct
- 4010 Rawlins St