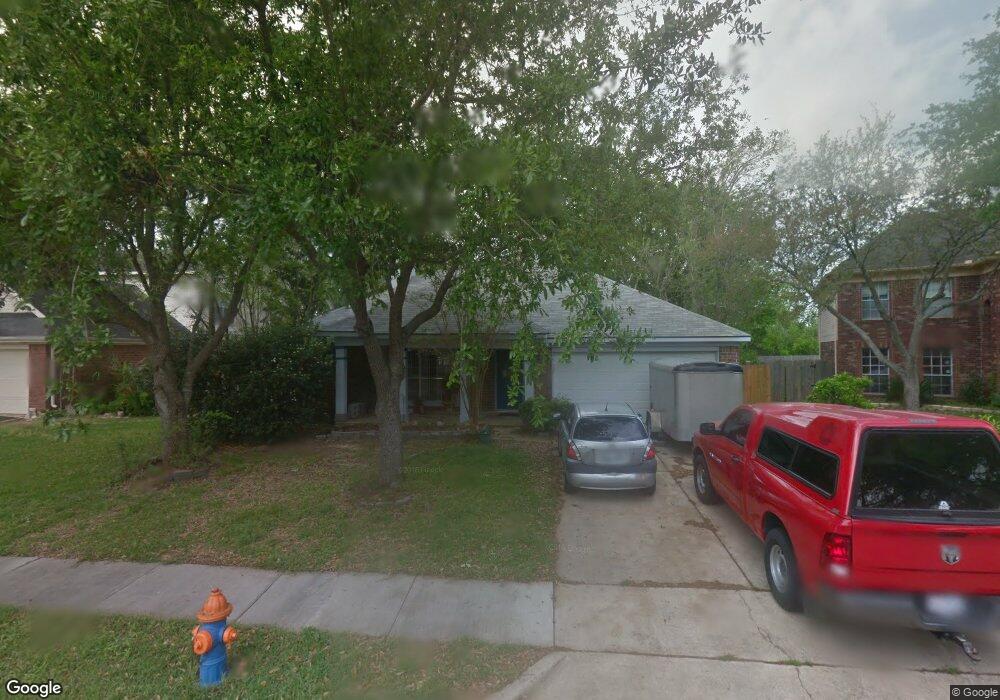
3906 Spring Circle Dr W Pearland, TX 77584
Outlying Friendswood City NeighborhoodEstimated Value: $275,531 - $292,000
3
Beds
2
Baths
1,474
Sq Ft
$194/Sq Ft
Est. Value
About This Home
This home is located at 3906 Spring Circle Dr W, Pearland, TX 77584 and is currently estimated at $286,633, approximately $194 per square foot. 3906 Spring Circle Dr W is a home located in Brazoria County with nearby schools including Magnolia Elementary School, Pearland Junior High School South, and Sam Jamison Middle School.
Ownership History
Date
Name
Owned For
Owner Type
Purchase Details
Closed on
Jun 17, 2019
Sold by
Springer Jacob and Springer Laura
Bought by
Oehlke Melissa
Current Estimated Value
Home Financials for this Owner
Home Financials are based on the most recent Mortgage that was taken out on this home.
Original Mortgage
$176,000
Outstanding Balance
$154,747
Interest Rate
4.1%
Mortgage Type
New Conventional
Estimated Equity
$131,886
Purchase Details
Closed on
Feb 11, 2014
Sold by
Nickolai Nicole Patricia and Blythe Nicole P
Bought by
Springer Jacob
Home Financials for this Owner
Home Financials are based on the most recent Mortgage that was taken out on this home.
Original Mortgage
$121,600
Interest Rate
4.56%
Mortgage Type
New Conventional
Purchase Details
Closed on
Nov 9, 2001
Sold by
Blythe Bobby E
Bought by
Nickolai Nicole Patricia and Blythe Nicole P
Create a Home Valuation Report for This Property
The Home Valuation Report is an in-depth analysis detailing your home's value as well as a comparison with similar homes in the area
Home Values in the Area
Average Home Value in this Area
Purchase History
| Date | Buyer | Sale Price | Title Company |
|---|---|---|---|
| Oehlke Melissa | -- | Title Alliance Of Houston | |
| Springer Jacob | -- | Alamo Title Company | |
| Nickolai Nicole Patricia | -- | -- |
Source: Public Records
Mortgage History
| Date | Status | Borrower | Loan Amount |
|---|---|---|---|
| Open | Oehlke Melissa | $176,000 | |
| Previous Owner | Springer Jacob | $121,600 | |
| Closed | Nickolai Nicole Patricia | $0 |
Source: Public Records
Tax History Compared to Growth
Tax History
| Year | Tax Paid | Tax Assessment Tax Assessment Total Assessment is a certain percentage of the fair market value that is determined by local assessors to be the total taxable value of land and additions on the property. | Land | Improvement |
|---|---|---|---|---|
| 2025 | $4,124 | $255,860 | $27,570 | $228,290 |
| 2023 | $4,124 | $229,065 | $27,570 | $230,920 |
| 2022 | $5,032 | $209,190 | $27,570 | $181,620 |
| 2021 | $5,001 | $194,100 | $25,450 | $168,650 |
| 2020 | $4,643 | $172,100 | $21,210 | $150,890 |
| 2019 | $4,078 | $151,100 | $21,210 | $129,890 |
| 2018 | $3,983 | $148,250 | $21,210 | $127,040 |
| 2017 | $4,003 | $148,250 | $21,210 | $127,040 |
| 2016 | $3,721 | $148,250 | $21,210 | $127,040 |
| 2014 | $2,304 | $119,990 | $21,210 | $98,780 |
Source: Public Records
Map
Nearby Homes
- 3730 Aubrell Rd
- 3602 Lindhaven Dr
- 5205 Spring Branch Dr
- 5506 Songbird
- 3902 Basil Ct
- 5101 Big Spring Dr
- 5006 Lockhart Dr
- 3910 Greenwood Dr
- 6112 Tomorrow Cir
- 16622 Mclean Rd
- 3704 Eaglet Trail
- 6436 Grace Ln
- 4009 Ravencrest Ct
- 4605 Lakefront Terrace Dr
- 16719 Mclean Rd
- 2739 Wagon Trail Rd
- 3510 Dorsey Ln
- 4605 Chaperel Dr
- 3307 Norma Ln
- 6404 Kale Ct
- 3906 Spring Circle Dr W Unit 1
- 3908 Spring Circle Dr W
- 3904 Spring Circle Dr W
- 3910 Spring Circle Dr W
- 3903 Spring Circle Dr W
- 3901 Spring Circle Dr W
- 3905 Spring Circle Dr W
- 3912 Spring Circle Dr W
- 5407 Spring Circle Dr
- 3902 Spring Circle Dr W
- 3907 Spring Circle Dr W
- 3902 Spring River Dr
- 3904 Spring River Dr
- 5405 Spring Circle Dr
- 3906 Spring River Dr
- 3914 Spring Circle Dr W
- 3914 Spring Cir
- 3909 Spring Circle Dr W
- 3908 Spring River Dr
- 5403 Spring Circle Dr