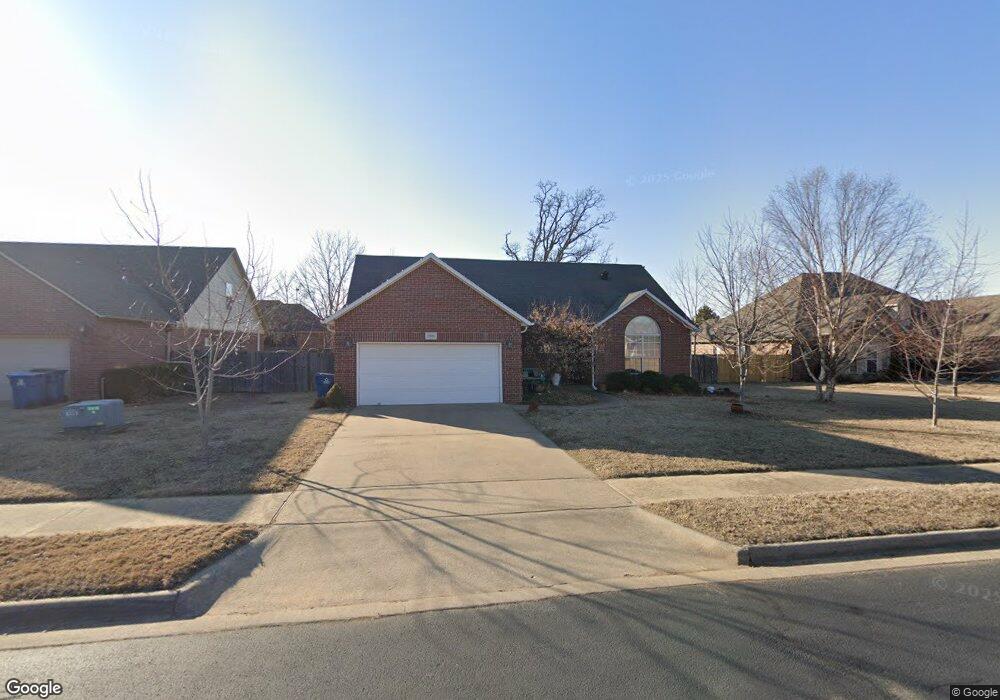
3906 SW Hawthorne St Bentonville, AR 72712
Estimated Value: $487,062 - $503,000
5
Beds
3
Baths
2,333
Sq Ft
$212/Sq Ft
Est. Value
About This Home
This home is located at 3906 SW Hawthorne St, Bentonville, AR 72712 and is currently estimated at $495,266, approximately $212 per square foot. 3906 SW Hawthorne St is a home located in Benton County with nearby schools including Bright Field Middle School, Willowbrook Elementary School, and Fulbright Junior High School.
Ownership History
Date
Name
Owned For
Owner Type
Purchase Details
Closed on
Mar 5, 2009
Sold by
Us Bank National Association
Bought by
Barnett Kirk and Barnett April
Current Estimated Value
Home Financials for this Owner
Home Financials are based on the most recent Mortgage that was taken out on this home.
Original Mortgage
$167,902
Outstanding Balance
$106,475
Interest Rate
5.16%
Estimated Equity
$388,791
Purchase Details
Closed on
Oct 20, 2008
Sold by
Dunlap David F and Dunlap Kayla
Bought by
Us Bank National Association
Purchase Details
Closed on
May 25, 2005
Sold by
Tommy Walker Construction Inc
Bought by
Dunlap David F and Dunlap Kayla
Home Financials for this Owner
Home Financials are based on the most recent Mortgage that was taken out on this home.
Original Mortgage
$204,000
Interest Rate
8.25%
Mortgage Type
Adjustable Rate Mortgage/ARM
Purchase Details
Closed on
Dec 17, 2003
Bought by
Walker Const
Create a Home Valuation Report for This Property
The Home Valuation Report is an in-depth analysis detailing your home's value as well as a comparison with similar homes in the area
Home Values in the Area
Average Home Value in this Area
Purchase History
| Date | Buyer | Sale Price | Title Company |
|---|---|---|---|
| Barnett Kirk | $171,000 | Professional Land Title Comp | |
| Us Bank National Association | $154,250 | None Available | |
| Dunlap David F | $204,000 | None Available | |
| Walker Const | $38,000 | -- |
Source: Public Records
Mortgage History
| Date | Status | Borrower | Loan Amount |
|---|---|---|---|
| Open | Barnett Kirk | $167,902 | |
| Previous Owner | Dunlap David F | $204,000 |
Source: Public Records
Tax History Compared to Growth
Tax History
| Year | Tax Paid | Tax Assessment Tax Assessment Total Assessment is a certain percentage of the fair market value that is determined by local assessors to be the total taxable value of land and additions on the property. | Land | Improvement |
|---|---|---|---|---|
| 2025 | $3,384 | $80,904 | $14,000 | $66,904 |
| 2024 | $3,245 | $80,904 | $14,000 | $66,904 |
| 2023 | $3,090 | $53,200 | $8,000 | $45,200 |
| 2022 | $2,653 | $53,200 | $8,000 | $45,200 |
| 2021 | $2,506 | $53,200 | $8,000 | $45,200 |
| 2020 | $2,395 | $43,490 | $8,400 | $35,090 |
| 2019 | $2,395 | $43,490 | $8,400 | $35,090 |
| 2018 | $2,355 | $43,490 | $8,400 | $35,090 |
| 2017 | $2,042 | $43,490 | $8,400 | $35,090 |
| 2016 | $2,042 | $43,490 | $8,400 | $35,090 |
| 2015 | $2,282 | $36,920 | $6,000 | $30,920 |
| 2014 | $1,932 | $36,920 | $6,000 | $30,920 |
Source: Public Records
Map
Nearby Homes
- 2402 SW Aster Way
- 1813 SW Pine Ave
- 2303 SW Chinquapin Ave
- 4004 SW Banbury Dr
- 4203 SW Lilac St
- 4508 SW Birmingham St
- 2508 SW Nottingham Ave
- 1602 SW Montrose Ave
- 1812 SW Edinburgh Ave
- 4605 SW Barton St
- 2904 SW Little Elm Loop
- 2603 SW Hampton Ave
- 1300 SW Willow Bend Ave
- 3200 SW Rosemont Ave
- 3006 SW Deerfield Blvd
- 4601 SW Hollowbrook St
- 4305 SW Layton Rd
- 4804 SW Scarlet Oak St
- 3900 SW Layton Rd
- 3402 SW Crosswinds Blvd
- 3907 SW Sycamore St
- 3909 SW Sycamore St
- 3910 SW Hawthorne St
- 3902 SW Hawthorne St
- 3907 SW Hawthorne St
- 3905 SW Hawthorne St
- 3909 SW Hawthorne St
- 3911 SW Sycamore St
- 3903 SW Sycamore St
- 3903 SW Hawthorne St
- 3911 SW Hawthorne St
- 3912 SW Hawthorne St
- 2101 SW Wildwood Ave
- 3913 SW Sycamore St
- 2001 SW Wildwood Ave
- 2103 SW Wildwood Ave
- 3913 SW Hawthorne St
- 3906 SW Sycamore St
- 3908 SW Sycamore St
- 3904 SW Sycamore St