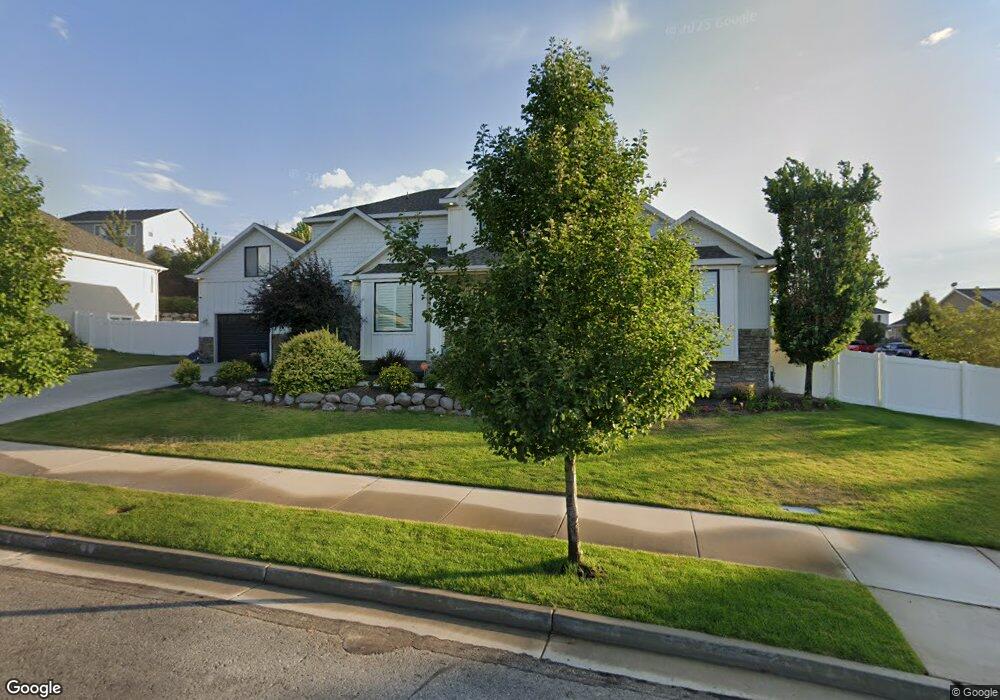
3906 W Bethpage Ct South Jordan, UT 84095
Oquirrh Park NeighborhoodEstimated Value: $848,000 - $1,096,686
5
Beds
3
Baths
4,850
Sq Ft
$202/Sq Ft
Est. Value
About This Home
This home is located at 3906 W Bethpage Ct, South Jordan, UT 84095 and is currently estimated at $980,922, approximately $202 per square foot. 3906 W Bethpage Ct is a home located in Salt Lake County with nearby schools including Eastlake Elementary School, Elk Ridge Middle School, and Mountain West Montessori Academy.
Ownership History
Date
Name
Owned For
Owner Type
Purchase Details
Closed on
Oct 4, 2023
Sold by
Tyler Joseph Pettit and Tyler Devrie
Bought by
Kramer Bradley and Kramer Julia
Current Estimated Value
Purchase Details
Closed on
Apr 15, 2022
Sold by
Pettit Tyler Joseph and Fielding Devire
Bought by
Pettit Tyler J
Home Financials for this Owner
Home Financials are based on the most recent Mortgage that was taken out on this home.
Original Mortgage
$937,500
Interest Rate
3.76%
Mortgage Type
New Conventional
Purchase Details
Closed on
Apr 11, 2022
Sold by
Pettit Tyler J
Bought by
Tyler Joseph Pettit And Devire Fielding Petti
Home Financials for this Owner
Home Financials are based on the most recent Mortgage that was taken out on this home.
Original Mortgage
$937,500
Interest Rate
3.76%
Mortgage Type
New Conventional
Purchase Details
Closed on
Jan 3, 2020
Sold by
Pettit Tyler J
Bought by
Pettit Tyler Joseph and Pettit Devrie Fielding
Home Financials for this Owner
Home Financials are based on the most recent Mortgage that was taken out on this home.
Original Mortgage
$490,000
Interest Rate
3.6%
Mortgage Type
New Conventional
Purchase Details
Closed on
Dec 20, 2019
Sold by
Pettit Tyler J and Pettit Devrie Devrie
Bought by
Pettit Tyler J
Home Financials for this Owner
Home Financials are based on the most recent Mortgage that was taken out on this home.
Original Mortgage
$490,000
Interest Rate
3.6%
Mortgage Type
New Conventional
Purchase Details
Closed on
Feb 24, 2017
Sold by
Pettit Tyler J and Pettit Devrie
Bought by
Pettit Tyler Joseph and Pettit Devrie Fielding
Purchase Details
Closed on
Sep 22, 2016
Sold by
Pettit Tyler J
Bought by
Pettit Tyler J and Pettit Devrie
Home Financials for this Owner
Home Financials are based on the most recent Mortgage that was taken out on this home.
Original Mortgage
$510,000
Interest Rate
3.45%
Mortgage Type
New Conventional
Purchase Details
Closed on
Jul 8, 2014
Sold by
Home Center Construction Co Llc
Bought by
Pettit Tyler J and Pettit Devrie
Home Financials for this Owner
Home Financials are based on the most recent Mortgage that was taken out on this home.
Original Mortgage
$461,898
Interest Rate
4.07%
Mortgage Type
New Conventional
Purchase Details
Closed on
Nov 30, 2012
Sold by
Boyer Jordan Heights Lc
Bought by
Home Center Construction Co Llc
Create a Home Valuation Report for This Property
The Home Valuation Report is an in-depth analysis detailing your home's value as well as a comparison with similar homes in the area
Home Values in the Area
Average Home Value in this Area
Purchase History
| Date | Buyer | Sale Price | Title Company |
|---|---|---|---|
| Kramer Bradley | -- | Meridian Title Company | |
| Pettit Tyler J | -- | Capstone Title & Escrow | |
| Pettit Tyler J | -- | Capstone Title & Escrow | |
| Tyler Joseph Pettit And Devire Fielding Petti | -- | -- | |
| Pettit Tyler J | -- | Capstone Title & Escrow | |
| Pettit Tyler Joseph | -- | Accommodation | |
| Pettit Tyler J | -- | Capstone Title & Escrow | |
| Pettit Tyler Joseph | -- | None Available | |
| Pettit Tyler J | -- | Accommodation | |
| Pettit Tyler J | -- | Eagle Gate Title Ins Agency | |
| Pettit Tyler J | -- | Metro National Title | |
| Home Center Construction Co Llc | -- | Landmark Title |
Source: Public Records
Mortgage History
| Date | Status | Borrower | Loan Amount |
|---|---|---|---|
| Previous Owner | Pettit Tyler J | $937,500 | |
| Previous Owner | Pettit Tyler J | $937,500 | |
| Previous Owner | Pettit Tyler J | $490,000 | |
| Previous Owner | Pettit Tyler J | $510,000 | |
| Previous Owner | Pettit Tyler J | $461,898 | |
| Closed | Kramer Bradley | $0 |
Source: Public Records
Tax History Compared to Growth
Tax History
| Year | Tax Paid | Tax Assessment Tax Assessment Total Assessment is a certain percentage of the fair market value that is determined by local assessors to be the total taxable value of land and additions on the property. | Land | Improvement |
|---|---|---|---|---|
| 2025 | $5,152 | $1,017,700 | $275,500 | $742,200 |
| 2024 | $5,152 | $978,200 | $262,400 | $715,800 |
| 2023 | $5,268 | $920,900 | $254,700 | $666,200 |
| 2022 | $5,268 | $925,000 | $249,800 | $675,200 |
| 2021 | $4,434 | $681,800 | $206,500 | $475,300 |
| 2020 | $4,339 | $634,200 | $206,500 | $427,700 |
| 2019 | $4,090 | $607,100 | $195,400 | $411,700 |
| 2018 | $3,879 | $572,900 | $194,300 | $378,600 |
| 2017 | $3,809 | $551,300 | $190,900 | $360,400 |
| 2016 | $3,672 | $536,900 | $176,500 | $360,400 |
| 2015 | $3,672 | $489,700 | $178,200 | $311,500 |
| 2014 | $1,432 | $103,200 | $103,200 | $0 |
Source: Public Records
Map
Nearby Homes
- 11029 Hampton Way Unit 156
- 10988 S Greenvale Ct
- 10984 S Nellis Dune Ct
- 3907 W Tottori Dune Dr
- 3884 Sand Lake Dr
- Princeton Plan at High Pointe
- Sheridan Plan at High Pointe
- Dashell Plan at High Pointe
- Dakota Plan at High Pointe
- Olympus Plan at High Pointe
- Sweetwater Plan at High Pointe
- Roosevelt Plan at High Pointe
- Witzel Plan at High Pointe
- 10934 Little Sahara Dr
- 10941 Little Sahara Dr
- 10963 S Coastal Dune Dr
- 10918 Little Sahara Dr Unit 1001
- 10931 S Glamis Dune Dr
- 3794 Angelica Way
- 3749 W Mandrake Way
- 3906 W Bethpage Ct Unit 101
- 11006 S Hampton Way Unit 716
- 3924 W Bethpage Ct Unit 102
- 11004 S Hampton Way Unit 715
- 11004 S Hampton Way
- 11003 S Kelso Dune Dr
- 11007 S Hampton Way
- 3909 W Bethpage Ct Unit 109
- 3909 W Bethpage Ct
- 10998 S Eureka Dune Dr
- 3887 W Rasor Dune Dr
- 3937 W Sahara Dune Dr
- 11001 S Kelso Dune Dr Unit 740
- 3923 W Bethpage Ct Unit 108
- 3883 W Ivey Ranch Rd
- 3942 W Bethpage Ct Unit 103
- 10996 S Eureka Dune Dr
- 3857 W Rasor Dune Dr Unit 833
- 3857 W Rasor Dune Dr
- 3874 W Ivey Ranch Rd