Estimated Value: $231,000 - $251,000
--
Bed
2
Baths
1,554
Sq Ft
$156/Sq Ft
Est. Value
About This Home
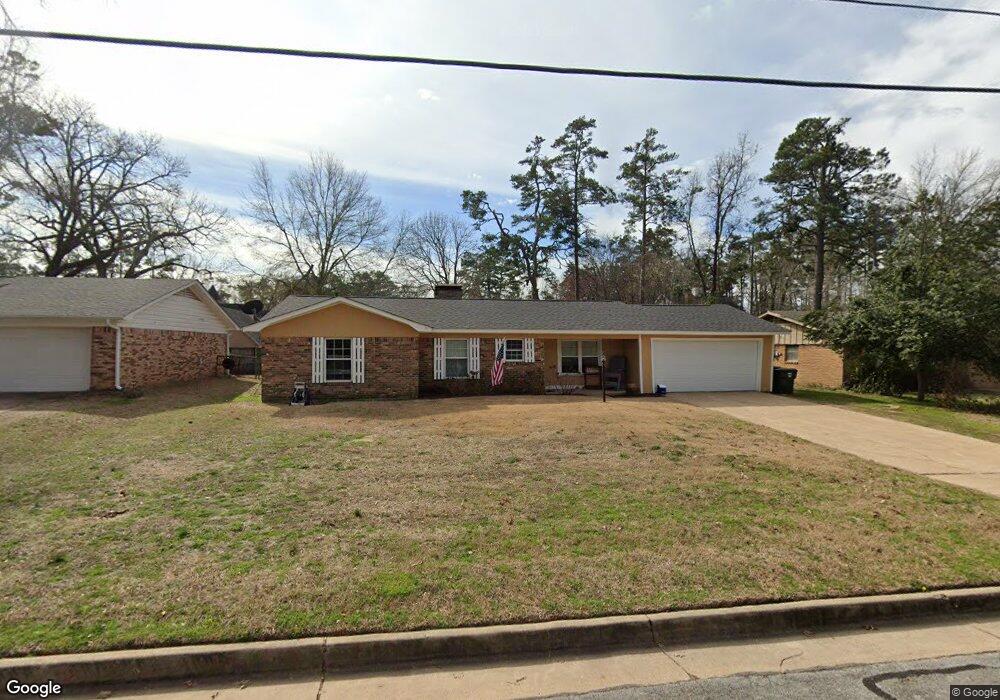
This home is located at 3907 Belle Mere St, Tyler, TX 75701 and is currently estimated at $242,192, approximately $155 per square foot. 3907 Belle Mere St is a home located in Smith County with nearby schools including Clarkston Elementary School, Moore Middle School, and Hubbard Middle School.
Ownership History
Date
Name
Owned For
Owner Type
Purchase Details
Closed on
Dec 3, 2021
Sold by
Cartus Financial Corporation
Bought by
Birt Roger C and Birt Tania M
Current Estimated Value
Purchase Details
Closed on
Nov 22, 2021
Sold by
Cartus Financial Corporation
Bought by
Birt Roger C and Birt Tania M
Purchase Details
Closed on
Nov 1, 2021
Sold by
Alan Ezell Bryan and Alan Melinda
Bought by
Cartus Financial Corporation
Purchase Details
Closed on
Aug 18, 2008
Sold by
Tomlin Roy E and Tomlin Rosemary
Bought by
Ezell Bryan Alan and Ezell Melinda
Home Financials for this Owner
Home Financials are based on the most recent Mortgage that was taken out on this home.
Original Mortgage
$116,303
Interest Rate
6.38%
Mortgage Type
Purchase Money Mortgage
Create a Home Valuation Report for This Property
The Home Valuation Report is an in-depth analysis detailing your home's value as well as a comparison with similar homes in the area
Home Values in the Area
Average Home Value in this Area
Purchase History
| Date | Buyer | Sale Price | Title Company |
|---|---|---|---|
| Birt Roger C | -- | None Listed On Document | |
| Birt Roger C | -- | None Listed On Document | |
| Cartus Financial Corporation | -- | New Title Company Name | |
| Ezell Bryan Alan | -- | None Available |
Source: Public Records
Mortgage History
| Date | Status | Borrower | Loan Amount |
|---|---|---|---|
| Previous Owner | Ezell Bryan Alan | $116,303 |
Source: Public Records
Tax History Compared to Growth
Tax History
| Year | Tax Paid | Tax Assessment Tax Assessment Total Assessment is a certain percentage of the fair market value that is determined by local assessors to be the total taxable value of land and additions on the property. | Land | Improvement |
|---|---|---|---|---|
| 2025 | $3,761 | $194,094 | $34,710 | $159,384 |
| 2024 | $3,761 | $221,055 | $24,220 | $196,835 |
| 2023 | $3,930 | $225,425 | $24,220 | $201,205 |
| 2022 | $3,312 | $169,077 | $18,165 | $150,912 |
| 2021 | $3,160 | $150,596 | $18,165 | $132,431 |
| 2020 | $2,973 | $138,943 | $18,165 | $120,778 |
| 2019 | $3,082 | $140,943 | $12,110 | $128,833 |
| 2018 | $2,922 | $134,365 | $12,110 | $122,255 |
| 2017 | $2,896 | $135,666 | $12,110 | $123,556 |
| 2016 | $2,689 | $125,957 | $12,110 | $113,847 |
| 2015 | $2,272 | $121,422 | $12,110 | $109,312 |
| 2014 | $2,272 | $117,849 | $12,110 | $105,739 |
Source: Public Records
Map
Nearby Homes
- 3913 Belle Mere St
- 3950 Hanover Place
- 3962 Hanover Place
- 2613 Chelsea Dr
- 2527 Westminster Dr
- 4021 Hanover Place
- 4025 Hanover Place
- 4029 Hanover Place
- 4024 Hanover Place
- 4037 Hanover Place
- 2216 Gish Ln
- 3109 Campus Cir
- 3108 Williamsburg Cir
- 3205 Timberlane Dr
- 3606 Trailwood Ct
- 2902 Shenandoah Dr
- 3618 Trailwood Ct
- 8226 County Road 219
- 3617 Flagstone Dr
- 10130 State Highway 64 E
- 3901 Belle Mere St
- 3926 Charleston Park
- 3922 3922 Charleston Park
- 3922 Charleston Park
- 3930 Charleston Park
- 3919 Belle Mere St
- 3833 Belle Mere St
- 3833 3833 Belle Mere
- 3910 Belle Mere St
- 3918 Charleston Park
- 3900 Belle Mere St
- 3916 Belle Mere St
- 3923 Belle Mere St
- 3829 Belle Mere St
- 3916 3916 Belle Mere
- 3938 3938 Charleston Park
- 3832 Belle Mere St
- 3922 Belle Mere St
- 3942 Charleston Park
- 3942 3942 Charleston Park