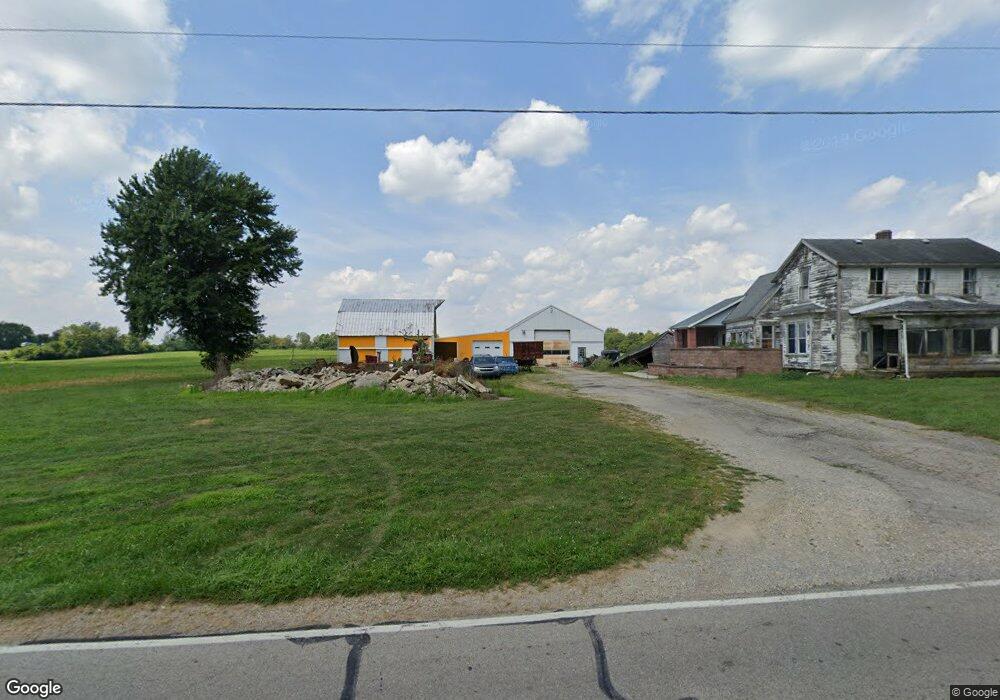
3907 Bosart Rd Springfield, OH 45503
Estimated Value: $220,000 - $311,000
2
Beds
1
Bath
1,036
Sq Ft
$270/Sq Ft
Est. Value
About This Home
This home is located at 3907 Bosart Rd, Springfield, OH 45503 and is currently estimated at $279,628, approximately $269 per square foot. 3907 Bosart Rd is a home located in Clark County with nearby schools including Northridge Elementary School, Kenton Ridge Middle & High School, and Emmanuel Christian Academy.
Ownership History
Date
Name
Owned For
Owner Type
Purchase Details
Closed on
Jul 3, 2025
Sold by
Deselem Pamela J
Bought by
Deselem John K and Deselem Natalie S
Current Estimated Value
Home Financials for this Owner
Home Financials are based on the most recent Mortgage that was taken out on this home.
Original Mortgage
$86,506
Outstanding Balance
$86,360
Interest Rate
6.86%
Mortgage Type
Seller Take Back
Estimated Equity
$193,268
Purchase Details
Closed on
Aug 16, 2011
Sold by
Ayars John D and Ayars Bonnie J
Bought by
Deselem Steven L and Deselem Pamela J
Home Financials for this Owner
Home Financials are based on the most recent Mortgage that was taken out on this home.
Original Mortgage
$150,000
Interest Rate
4.4%
Mortgage Type
Seller Take Back
Purchase Details
Closed on
May 9, 2001
Sold by
Deselem Steven L and Deselem Pamela J
Bought by
Ayars John D and Ayars Bonnie J
Purchase Details
Closed on
Feb 28, 1992
Create a Home Valuation Report for This Property
The Home Valuation Report is an in-depth analysis detailing your home's value as well as a comparison with similar homes in the area
Home Values in the Area
Average Home Value in this Area
Purchase History
| Date | Buyer | Sale Price | Title Company |
|---|---|---|---|
| Deselem John K | $214,000 | None Listed On Document | |
| Deselem Steven L | $185,000 | Attorney | |
| Ayars John D | $100,000 | -- | |
| -- | $91,000 | -- |
Source: Public Records
Mortgage History
| Date | Status | Borrower | Loan Amount |
|---|---|---|---|
| Open | Deselem John K | $86,506 | |
| Previous Owner | Deselem Steven L | $150,000 |
Source: Public Records
Tax History
| Year | Tax Paid | Tax Assessment Tax Assessment Total Assessment is a certain percentage of the fair market value that is determined by local assessors to be the total taxable value of land and additions on the property. | Land | Improvement |
|---|---|---|---|---|
| 2025 | $1,630 | $102,390 | $84,430 | $17,960 |
| 2024 | $7,254 | $72,780 | $58,220 | $14,560 |
| 2023 | $4,983 | $72,780 | $58,220 | $14,560 |
| 2022 | $11,799 | $72,780 | $58,220 | $14,560 |
| 2021 | $1,570 | $57,850 | $45,130 | $12,720 |
| 2020 | $1,571 | $57,850 | $45,130 | $12,720 |
| 2019 | $1,601 | $57,850 | $45,130 | $12,720 |
| 2018 | $1,835 | $51,630 | $39,810 | $11,820 |
| 2017 | $1,579 | $51,633 | $39,813 | $11,820 |
| 2016 | $1,392 | $47,828 | $39,813 | $8,015 |
| 2015 | $13,427 | $43,117 | $35,210 | $7,907 |
| 2014 | $1,362 | $43,117 | $35,210 | $7,907 |
| 2013 | $6,717 | $43,117 | $35,210 | $7,907 |
Source: Public Records
Map
Nearby Homes
- 4028 Ryland Dr Unit 4028
- 3969 Covington Dr Unit 3969
- 4500 Bosart Rd
- 1831 Pinehurst Dr Unit 37
- 1711 Pinehurst Dr
- 3126 Lakeview Ct Unit 3126
- 1507 Kingsgate Rd
- 1505 Kingsgate Rd
- 1503 Kingsgate Rd
- 1500 Kingsgate Rd
- 1502 Kingsgate Rd
- 1500 Kingsgate Rd Unit 19430
- 1502 Kingsgate Rd Unit 19432
- 1509 Kingsgate Rd
- 3631 Kingsgate Ln
- 2332 Villa Rd
- 4256 Midfield St Unit 9
- 4446 Ridgewood Rd E Unit 3
- 4652 Reno Ln Unit 15
- 1341 Student Ave
- 3939 Bosart Rd
- 4010 Ryland Dr Unit 4010
- 4024 Ryland Dr
- 4042 Ryland Dr Unit 4042
- 4012 Ryland Dr
- 4022 Ryland Dr Unit 94042
- 3967 Covington Dr Unit 3967
- 4030 Ryland Dr
- 4040 Ryland Dr
- 4040 Ryland Dr Unit 4040
- 4040 Ryland Dr
- 4014 Ryland Dr Unit 4014
- 4020 Ryland Dr Unit 4020
- 4046 Ryland Dr Unit O
- 4032 Ryland Dr Unit 4032
- 4038 Ryland Dr Unit 4038
- 4060 Ryland Dr Unit 4060
- 4016 Ryland Dr Unit 4016
- 3964 Covington Dr
- 4018 Ryland Dr Unit 4018
Your Personal Tour Guide
Ask me questions while you tour the home.