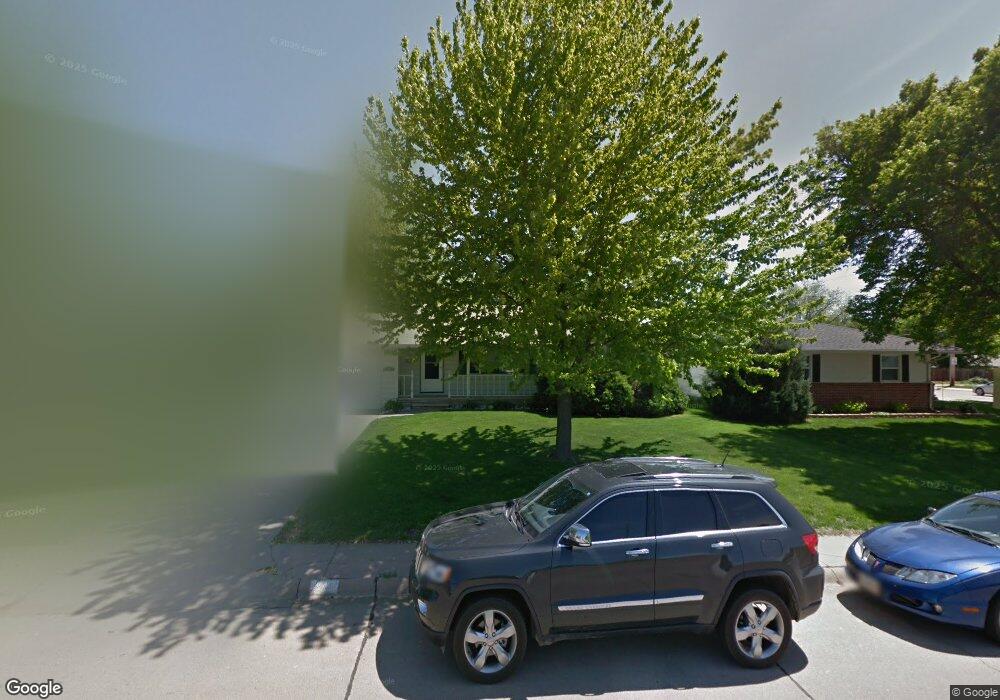
3907 E Ave Kearney, NE 68847
Estimated Value: $244,000 - $280,000
3
Beds
3
Baths
1,015
Sq Ft
$263/Sq Ft
Est. Value
About This Home
This home is located at 3907 E Ave, Kearney, NE 68847 and is currently estimated at $267,001, approximately $263 per square foot. 3907 E Ave is a home located in Buffalo County with nearby schools including Northeast Elementary School, Sunrise Middle School, and Kearney Senior High School.
Ownership History
Date
Name
Owned For
Owner Type
Purchase Details
Closed on
Apr 1, 2022
Sold by
Brock Brandon M and Brock Ana I
Bought by
Ellingson Peggy
Current Estimated Value
Purchase Details
Closed on
Mar 31, 2019
Sold by
Ellicott Allison N
Bought by
Brock Brandon M and Brock Ana I
Home Financials for this Owner
Home Financials are based on the most recent Mortgage that was taken out on this home.
Original Mortgage
$155,800
Interest Rate
4.4%
Mortgage Type
New Conventional
Purchase Details
Closed on
May 25, 2012
Sold by
Feltz Bo R and Feltz Becky K
Bought by
Ellicott Allison E
Home Financials for this Owner
Home Financials are based on the most recent Mortgage that was taken out on this home.
Original Mortgage
$111,600
Interest Rate
3.9%
Purchase Details
Closed on
Mar 21, 2005
Sold by
Graves Brian D and Graves Wendy J
Bought by
Feltz Bo R
Home Financials for this Owner
Home Financials are based on the most recent Mortgage that was taken out on this home.
Original Mortgage
$121,864
Interest Rate
5.66%
Create a Home Valuation Report for This Property
The Home Valuation Report is an in-depth analysis detailing your home's value as well as a comparison with similar homes in the area
Home Values in the Area
Average Home Value in this Area
Purchase History
| Date | Buyer | Sale Price | Title Company |
|---|---|---|---|
| Ellingson Peggy | $235,000 | Nebraska Title | |
| Brock Brandon M | $164,000 | None Available | |
| Ellicott Allison E | $139,500 | Barney | |
| Feltz Bo R | -- | -- |
Source: Public Records
Mortgage History
| Date | Status | Borrower | Loan Amount |
|---|---|---|---|
| Previous Owner | Brock Brandon M | $155,800 | |
| Previous Owner | Ellicott Allison E | $111,600 | |
| Previous Owner | Feltz Bo R | $121,864 |
Source: Public Records
Tax History
| Year | Tax Paid | Tax Assessment Tax Assessment Total Assessment is a certain percentage of the fair market value that is determined by local assessors to be the total taxable value of land and additions on the property. | Land | Improvement |
|---|---|---|---|---|
| 2025 | $611 | $212,545 | $43,515 | $169,030 |
| 2024 | -- | $202,245 | $42,250 | $159,995 |
| 2023 | $2,958 | $183,840 | $42,250 | $141,590 |
| 2022 | $2,958 | $168,530 | $42,070 | $126,460 |
| 2021 | $2,731 | $158,360 | $40,740 | $117,620 |
| 2020 | $2,713 | $156,835 | $39,215 | $117,620 |
| 2019 | $2,712 | $154,895 | $39,040 | $115,855 |
| 2018 | $2,480 | $143,660 | $33,320 | $110,340 |
| 2017 | $2,434 | $141,970 | $33,320 | $108,650 |
| 2016 | $2,414 | $141,970 | $33,320 | $108,650 |
| 2015 | $2,270 | $130,470 | $0 | $0 |
| 2014 | $2,708 | $142,045 | $0 | $0 |
Source: Public Records
Map
Nearby Homes
- 404 E 39th St
- 4003 G Ave
- 2108 E 41st St
- 2102 E 41st St
- 4215 Indian Rd
- 3506 D Ave
- 1 Indian Hills Dr
- 416 E 34th St
- 3902 L Ave
- 4611 N Regency Place
- 3 Parklane Place
- 4604 Pony Express Rd
- 4628 Linden Dr
- 3111 D Ave
- 4626 Parklane Dr
- 1203 E 34th St
- TBD Imperial Ave
- 222 E 30th St
- 919 E 31st St
- 5000 F Avenue Place
Your Personal Tour Guide
Ask me questions while you tour the home.