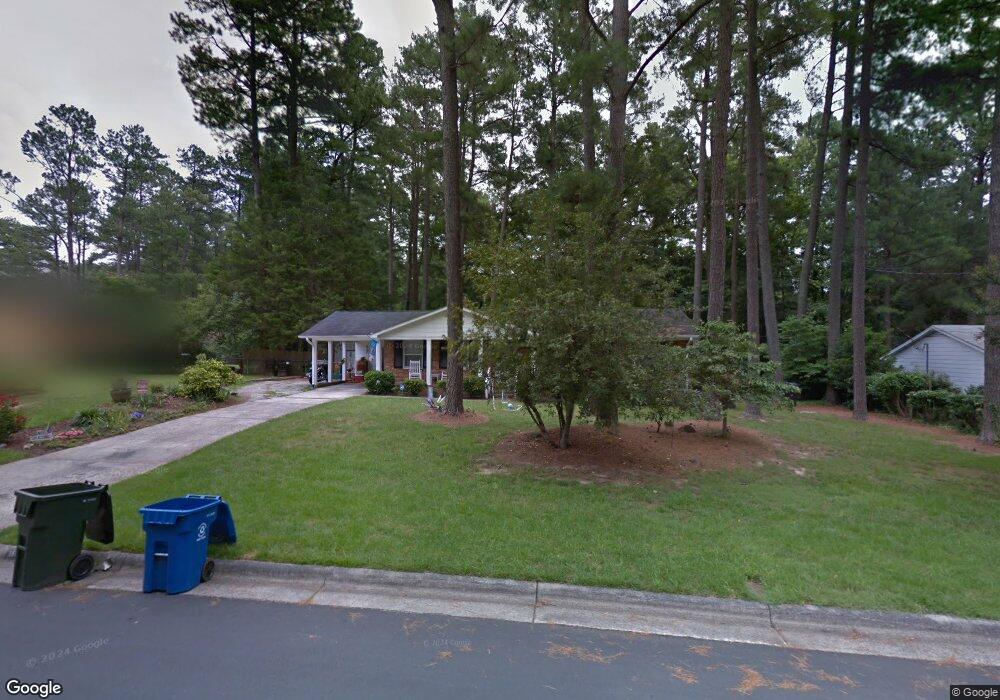
3907 Hillgrand Dr Durham, NC 27705
West Durham NeighborhoodEstimated Value: $355,000 - $407,000
3
Beds
2
Baths
1,325
Sq Ft
$288/Sq Ft
Est. Value
About This Home
This home is located at 3907 Hillgrand Dr, Durham, NC 27705 and is currently estimated at $381,204, approximately $287 per square foot. 3907 Hillgrand Dr is a home located in Durham County with nearby schools including Morehead Montessori, Forest View Elementary, and Brogden Middle.
Ownership History
Date
Name
Owned For
Owner Type
Purchase Details
Closed on
Oct 9, 2001
Sold by
Neigel Jack and Neigel Connie
Bought by
Younts Worth D and Younts Elizabeth
Current Estimated Value
Home Financials for this Owner
Home Financials are based on the most recent Mortgage that was taken out on this home.
Original Mortgage
$110,000
Interest Rate
6.87%
Purchase Details
Closed on
Jun 6, 2000
Sold by
Hopkins Seth and Hopkins Jane Doyle
Bought by
Neigel Jack and Neigel Connie
Home Financials for this Owner
Home Financials are based on the most recent Mortgage that was taken out on this home.
Original Mortgage
$80,000
Interest Rate
8.11%
Purchase Details
Closed on
Jul 15, 1999
Sold by
Bentel Ii Earl Franklin C and Wife Guni
Bought by
Hopkins Seth and Hopkins Janel Doyle
Home Financials for this Owner
Home Financials are based on the most recent Mortgage that was taken out on this home.
Original Mortgage
$99,920
Interest Rate
7.43%
Create a Home Valuation Report for This Property
The Home Valuation Report is an in-depth analysis detailing your home's value as well as a comparison with similar homes in the area
Home Values in the Area
Average Home Value in this Area
Purchase History
| Date | Buyer | Sale Price | Title Company |
|---|---|---|---|
| Younts Worth D | $130,000 | -- | |
| Neigel Jack | $127,000 | -- | |
| Hopkins Seth | $125,000 | -- |
Source: Public Records
Mortgage History
| Date | Status | Borrower | Loan Amount |
|---|---|---|---|
| Closed | Younts Worth D | $110,000 | |
| Previous Owner | Neigel Jack | $80,000 | |
| Previous Owner | Hopkins Seth | $99,920 |
Source: Public Records
Tax History
| Year | Tax Paid | Tax Assessment Tax Assessment Total Assessment is a certain percentage of the fair market value that is determined by local assessors to be the total taxable value of land and additions on the property. | Land | Improvement |
|---|---|---|---|---|
| 2025 | $3,402 | $343,236 | $126,900 | $216,336 |
| 2024 | $1,511 | $180,562 | $42,210 | $138,352 |
| 2023 | $2,365 | $180,562 | $42,210 | $138,352 |
| 2022 | $2,311 | $180,562 | $42,210 | $138,352 |
| 2021 | $2,300 | $180,562 | $42,210 | $138,352 |
| 2020 | $2,246 | $180,562 | $42,210 | $138,352 |
| 2019 | $2,246 | $180,562 | $42,210 | $138,352 |
| 2018 | $1,946 | $143,449 | $28,140 | $115,309 |
| 2017 | $1,932 | $143,449 | $28,140 | $115,309 |
| 2016 | $1,866 | $143,449 | $28,140 | $115,309 |
| 2015 | $1,644 | $118,752 | $27,251 | $91,501 |
| 2014 | $1,644 | $118,752 | $27,251 | $91,501 |
Source: Public Records
Map
Nearby Homes
- 10 Sunrise Place
- 4111 Talcott Dr
- 10 Forest Oaks Dr
- 74 Forest Oaks Dr
- 27 Forest Green Dr
- 4122 Westfield Dr
- 409 Morreene Rd
- 710 Constitution Dr Unit 206
- 710 Constitution Dr Unit A
- 205 Silas St
- 219 Silas St
- 309 Lionel St
- 512 Soapstone Dr
- 504 Soapstone Dr
- 508 Soapstone Dr
- 516 Soapstone Dr
- 708 Constitution Dr Unit F
- 412 Lionel St
- 706 Constitution Dr Unit 405
- 36 Georgetown Ct
- 3911 Tremont Dr
- 3911 Hillgrand Dr
- 3912 Inwood Dr
- 3908 Inwood Dr
- 3916 Inwood Dr
- 3906 Hillgrand Dr
- 3905 Tremont Dr
- 3900 Hillgrand Dr
- 3908 Tremont Dr
- 4003 Hillgrand Dr
- 3824 Hillgrand Dr
- 4000 Inwood Dr
- 3915 Inwood Dr
- 3911 Inwood Dr
- 3917 Inwood Dr
- 3900 Tremont Dr
- 3822 Hillgrand Dr
- 4002 Hillgrand Dr
- 3819 Hillgrand Dr
- 3903 Inwood Dr
Your Personal Tour Guide
Ask me questions while you tour the home.