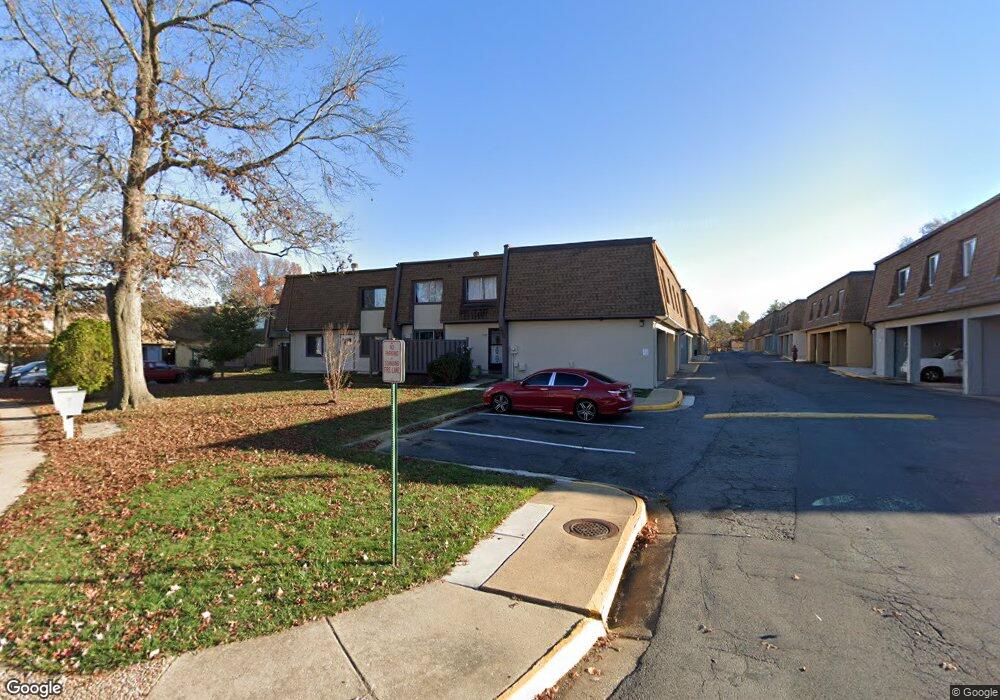
3908 Manzanita Place Alexandria, VA 22309
Woodlawn NeighborhoodEstimated Value: $277,502 - $285,000
2
Beds
1
Bath
1,100
Sq Ft
$256/Sq Ft
Est. Value
About This Home
This home is located at 3908 Manzanita Place, Alexandria, VA 22309 and is currently estimated at $281,167, approximately $255 per square foot. 3908 Manzanita Place is a home located in Fairfax County with nearby schools including Mount Vernon Woods Elementary School, Whitman Middle School, and Mount Vernon High.
Ownership History
Date
Name
Owned For
Owner Type
Purchase Details
Closed on
Apr 26, 2019
Sold by
Munir Muhammad and Munir Abida
Bought by
Munir Atif
Current Estimated Value
Purchase Details
Closed on
Jun 2, 2017
Sold by
The Bank Of New York Mellon
Bought by
Munir Muhammad
Purchase Details
Closed on
Apr 4, 2017
Sold by
Equity Trustees Llc A Virginia Limited L
Bought by
Bank Of New York Mellon
Purchase Details
Closed on
Mar 28, 2005
Sold by
Verrett Joseph
Bought by
Burrell Ma Shelna R
Home Financials for this Owner
Home Financials are based on the most recent Mortgage that was taken out on this home.
Original Mortgage
$168,000
Interest Rate
5.61%
Mortgage Type
Purchase Money Mortgage
Purchase Details
Closed on
Nov 27, 1995
Sold by
Dixon Julius B
Bought by
Verrett Joseph
Home Financials for this Owner
Home Financials are based on the most recent Mortgage that was taken out on this home.
Original Mortgage
$60,180
Interest Rate
7.47%
Mortgage Type
Purchase Money Mortgage
Create a Home Valuation Report for This Property
The Home Valuation Report is an in-depth analysis detailing your home's value as well as a comparison with similar homes in the area
Home Values in the Area
Average Home Value in this Area
Purchase History
| Date | Buyer | Sale Price | Title Company |
|---|---|---|---|
| Munir Atif | -- | Key Title | |
| Munir Muhammad | $145,000 | None Available | |
| Bank Of New York Mellon | $148,750 | None Available | |
| Burrell Ma Shelna R | $210,000 | -- | |
| Verrett Joseph | $59,200 | -- |
Source: Public Records
Mortgage History
| Date | Status | Borrower | Loan Amount |
|---|---|---|---|
| Previous Owner | Burrell Ma Shelna R | $168,000 | |
| Previous Owner | Verrett Joseph | $60,180 |
Source: Public Records
Tax History Compared to Growth
Tax History
| Year | Tax Paid | Tax Assessment Tax Assessment Total Assessment is a certain percentage of the fair market value that is determined by local assessors to be the total taxable value of land and additions on the property. | Land | Improvement |
|---|---|---|---|---|
| 2021 | $2,207 | $188,090 | $38,000 | $150,090 |
| 2020 | $2,100 | $177,440 | $35,000 | $142,440 |
| 2019 | $1,940 | $163,960 | $33,000 | $130,960 |
| 2018 | $1,884 | $159,150 | $32,000 | $127,150 |
| 2017 | $1,793 | $154,450 | $31,000 | $123,450 |
| 2016 | $1,789 | $154,450 | $31,000 | $123,450 |
| 2015 | $1,660 | $148,700 | $30,000 | $118,700 |
| 2014 | $1,540 | $138,330 | $28,000 | $110,330 |
Source: Public Records
Map
Nearby Homes
- 3878 Havenwood Place Unit 75D
- 3823 Monte Vista Place Unit 97D
- 3916 Woodhue Place Unit 8
- 7984 Audubon Ave Unit 203
- 7911 Martha Washington St
- 7947 Sausalito Place Unit 25C
- 3827 El Camino Place Unit 13
- 3804 El Cerrito Place Unit 4E
- 4111 Lawrence St
- 4207 Corcoran St
- 4300 Fielding St
- 7926 Russell Rd
- 7927 Ashboro Dr
- 8101 Richmond Hwy
- 4314 Gramercy Cir
- 3744 Shannons Green Way
- 3416 Sunny View Dr
- 7684 Audubon Meadow Way
- 3775 Shannons Green Way
- 3401 Blue Mallard Landing
- 3906 Manzanita Place Unit B
- 3908 Manzanita Place Unit D
- 3906 Manzanita Place Unit 67B
- 3900 Manzanita Place Unit E
- 3900 Manzanita Place Unit 67E
- 3900 Manzanita Place
- 3906 Manzanita Place
- 3902 Manzanita Place Unit C
- 3904 Manzanita Place
- 3902 Manzanita Place
- 3892 Manzanita Place Unit 66C
- 3890 Manzanita Place Unit 66E
- 3892 Manzanita Place
- 3890 Manzanita Place
- 3892 Manzanita Place Unit C
- 3890 Manzanita Place Unit E
- 3894 Manzanita Place
- 3894 Manzanita Place Unit 66A
- 3894 Manzanita Place Unit A
- 3898 Manzanita Place