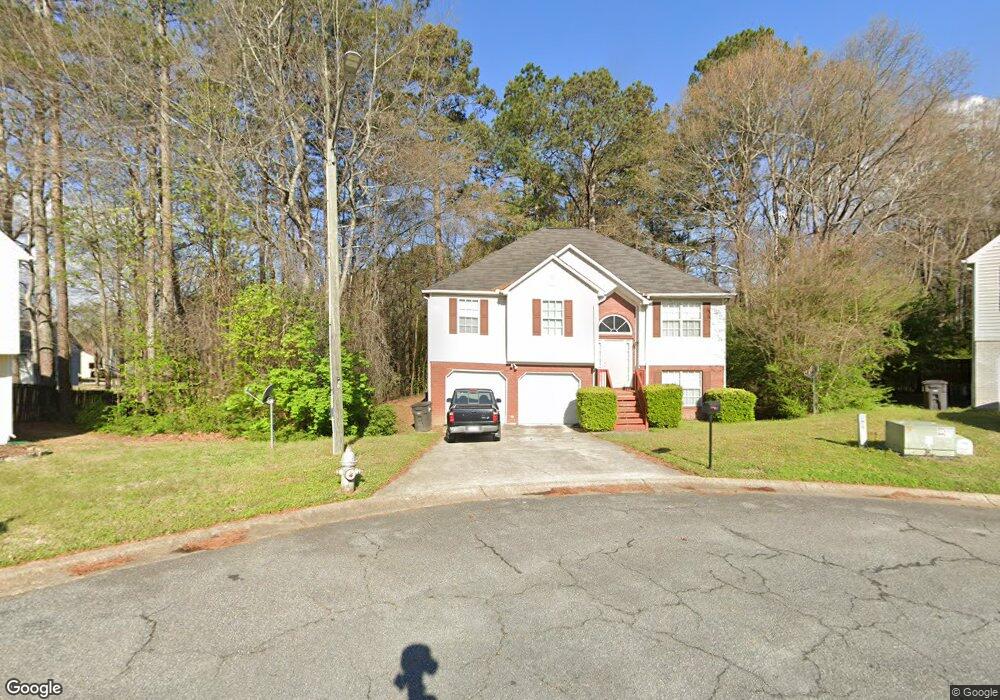
3908 Mistymorn Place Unit 11 Powder Springs, GA 30127
Estimated Value: $314,000 - $384,328
3
Beds
3
Baths
1,409
Sq Ft
$243/Sq Ft
Est. Value
About This Home
This home is located at 3908 Mistymorn Place Unit 11, Powder Springs, GA 30127 and is currently estimated at $343,082, approximately $243 per square foot. 3908 Mistymorn Place Unit 11 is a home located in Cobb County with nearby schools including Powder Springs Elementary School, Cooper Middle School, and McEachern High School.
Ownership History
Date
Name
Owned For
Owner Type
Purchase Details
Closed on
Jun 7, 2016
Sold by
Colfin Ai Ga 1 Llc
Bought by
Csh 2016 1 Borrower Llc
Current Estimated Value
Purchase Details
Closed on
Oct 2, 2012
Sold by
Bevel Terrence X
Bought by
Colfin Ai Ga1 Llc
Purchase Details
Closed on
Apr 4, 2006
Sold by
Bevel Cynthia Y
Bought by
Jp Morgan Chase Bk
Purchase Details
Closed on
Nov 14, 2003
Sold by
Moseley Matthew
Bought by
Bevel Cynthia Y and Bevel Terrence
Home Financials for this Owner
Home Financials are based on the most recent Mortgage that was taken out on this home.
Original Mortgage
$148,824
Interest Rate
5.93%
Mortgage Type
FHA
Purchase Details
Closed on
Jun 26, 1997
Sold by
Palladium Homes Inc
Bought by
Moseley M Bryan and Moseley Kimberly A
Home Financials for this Owner
Home Financials are based on the most recent Mortgage that was taken out on this home.
Original Mortgage
$109,550
Interest Rate
7.65%
Mortgage Type
FHA
Create a Home Valuation Report for This Property
The Home Valuation Report is an in-depth analysis detailing your home's value as well as a comparison with similar homes in the area
Home Values in the Area
Average Home Value in this Area
Purchase History
| Date | Buyer | Sale Price | Title Company |
|---|---|---|---|
| Csh 2016 1 Borrower Llc | -- | -- | |
| Colfin Ai Ga1 Llc | $82,000 | -- | |
| Jp Morgan Chase Bk | $67,915 | -- | |
| Bevel Cynthia Y | $150,000 | -- | |
| Moseley M Bryan | $109,400 | -- |
Source: Public Records
Mortgage History
| Date | Status | Borrower | Loan Amount |
|---|---|---|---|
| Previous Owner | Bevel Cynthia Y | $148,824 | |
| Previous Owner | Moseley M Bryan | $109,550 |
Source: Public Records
Tax History Compared to Growth
Tax History
| Year | Tax Paid | Tax Assessment Tax Assessment Total Assessment is a certain percentage of the fair market value that is determined by local assessors to be the total taxable value of land and additions on the property. | Land | Improvement |
|---|---|---|---|---|
| 2024 | $3,341 | $110,800 | $20,000 | $90,800 |
| 2023 | $3,341 | $110,800 | $20,000 | $90,800 |
| 2022 | $3,424 | $112,820 | $20,000 | $92,820 |
| 2021 | $2,195 | $72,336 | $12,000 | $60,336 |
| 2020 | $2,195 | $72,336 | $12,000 | $60,336 |
| 2019 | $1,795 | $59,140 | $12,000 | $47,140 |
| 2018 | $1,795 | $59,140 | $12,000 | $47,140 |
| 2017 | $1,241 | $43,180 | $6,400 | $36,780 |
| 2016 | $1,241 | $43,180 | $6,400 | $36,780 |
| 2015 | $1,338 | $45,428 | $6,400 | $39,028 |
| 2014 | $986 | $33,200 | $0 | $0 |
Source: Public Records
Map
Nearby Homes
- 4045 Compton Cir
- 4096 Mistymorn Ln
- 4186 Atlanta St
- 4086 Marietta St
- 4033 Louise St
- 4492 Long St
- 4079 Austell Powder Springs Rd
- Willow Plan at Pevensie Manor - Bungalow Series
- Cedar Plan at Pevensie Manor - Bungalow Series
- Cottonwood Plan at Pevensie Manor - Bungalow Series
- Maple Plan at Pevensie Manor - Bungalow Series
- Hawthorne Plan at Pevensie Manor - Bungalow Series
- 4135 Integrity Way
- 4137 Integrity Way
- 3810 Equity Ln
- 3831 Dillard St
- 4175 Integrity Way
- 4192 Integrity Way
- 3888 Lindley Cir
- 3936 Ladiga St
- 3904 Mistymorn Place
- 4176 New Towne Dr
- 0 Mistymorn Place Unit 3152584
- 0 Mistymorn Place Unit 8586893
- 3909 Mistymorn Place Unit Ga1325
- 3909 Mistymorn Place
- 3909 Mistymorn Place Unit GA13254
- 4174 New Towne Dr
- 3900 Mistymorn Place
- 3905 Mistymorn Place
- 4178 New Towne Dr
- 4071 Mistymorn Ln
- 3901 Mistymorn Place
- 4334 Compton Cir
- 4172 New Towne Dr
- 4067 Mistymorn Ln
- 4330 Compton Cir
- 4063 Mistymorn Ln Unit 2
- 4204 Mistymorn Point
- 4200 Mistymorn Point