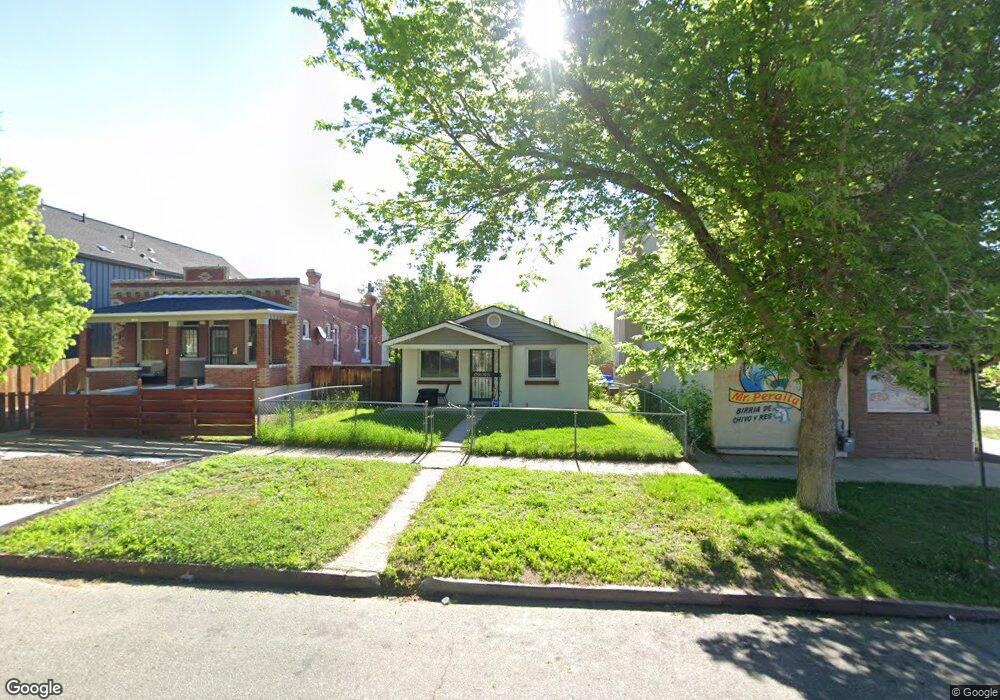
3908 Osage St Denver, CO 80211
Sunnyside NeighborhoodEstimated Value: $468,000 - $565,000
2
Beds
1
Bath
731
Sq Ft
$698/Sq Ft
Est. Value
About This Home
This home is located at 3908 Osage St, Denver, CO 80211 and is currently estimated at $510,049, approximately $697 per square foot. 3908 Osage St is a home located in Denver County with nearby schools including Bryant Webster Dual Language School, Denver Montessori Junior/Senior High School, and Skinner Middle School.
Ownership History
Date
Name
Owned For
Owner Type
Purchase Details
Closed on
Apr 28, 1995
Sold by
Stone Angelina M
Bought by
Terrell William R and Terrell Lolita P
Current Estimated Value
Home Financials for this Owner
Home Financials are based on the most recent Mortgage that was taken out on this home.
Original Mortgage
$31,750
Interest Rate
8.36%
Mortgage Type
FHA
Purchase Details
Closed on
Sep 1, 1993
Sold by
Stone Angelina M
Bought by
Styer Michael
Create a Home Valuation Report for This Property
The Home Valuation Report is an in-depth analysis detailing your home's value as well as a comparison with similar homes in the area
Home Values in the Area
Average Home Value in this Area
Purchase History
| Date | Buyer | Sale Price | Title Company |
|---|---|---|---|
| Terrell William R | $31,100 | -- | |
| Styer Michael | $24,300 | -- |
Source: Public Records
Mortgage History
| Date | Status | Borrower | Loan Amount |
|---|---|---|---|
| Closed | Terrell William R | $31,750 |
Source: Public Records
Tax History Compared to Growth
Tax History
| Year | Tax Paid | Tax Assessment Tax Assessment Total Assessment is a certain percentage of the fair market value that is determined by local assessors to be the total taxable value of land and additions on the property. | Land | Improvement |
|---|---|---|---|---|
| 2024 | $2,146 | $33,790 | $27,060 | $6,730 |
| 2023 | $2,099 | $33,790 | $27,060 | $6,730 |
| 2022 | $1,753 | $28,990 | $27,110 | $1,880 |
| 2021 | $1,692 | $29,820 | $27,890 | $1,930 |
| 2020 | $1,553 | $28,080 | $22,970 | $5,110 |
| 2019 | $1,509 | $28,080 | $22,970 | $5,110 |
| 2018 | $1,166 | $22,270 | $18,590 | $3,680 |
| 2017 | $1,162 | $22,270 | $18,590 | $3,680 |
| 2016 | $839 | $18,250 | $13,405 | $4,845 |
| 2015 | $804 | $18,250 | $13,405 | $4,845 |
| 2014 | $1,008 | $12,140 | $3,654 | $8,486 |
Source: Public Records
Map
Nearby Homes