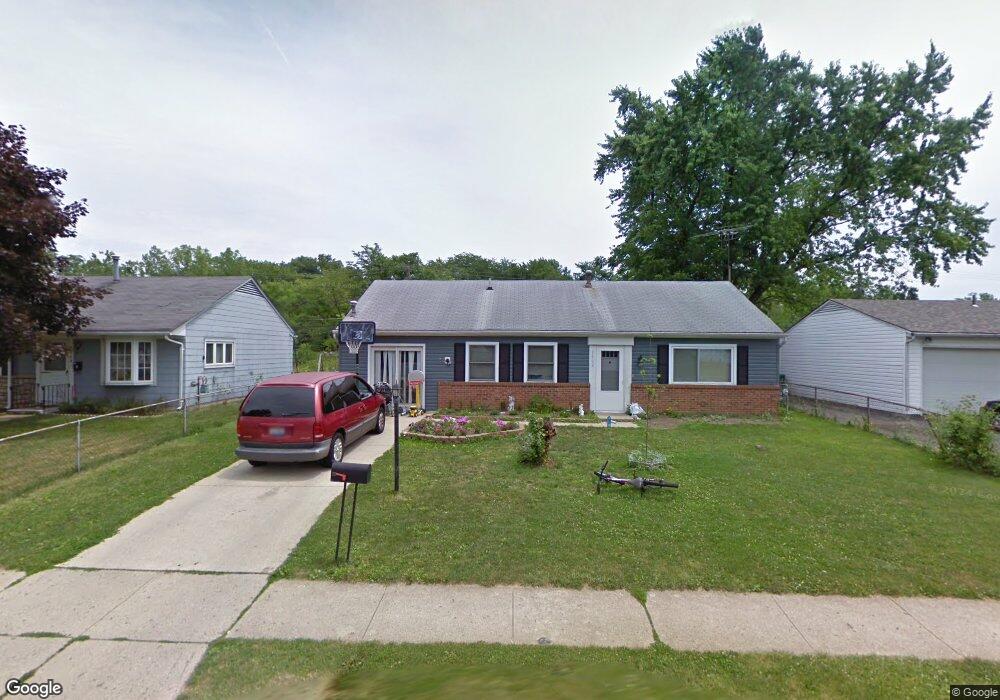
3908 Signal Dr Columbus, OH 43232
East Columbus-White Ash NeighborhoodEstimated Value: $183,000 - $225,000
3
Beds
2
Baths
1,196
Sq Ft
$169/Sq Ft
Est. Value
About This Home
This home is located at 3908 Signal Dr, Columbus, OH 43232 and is currently estimated at $201,854, approximately $168 per square foot. 3908 Signal Dr is a home located in Franklin County with nearby schools including Groveport Madison High School, Eastland Preparatory Academy, and A+ Arts Academy.
Ownership History
Date
Name
Owned For
Owner Type
Purchase Details
Closed on
Jul 10, 2014
Sold by
Bank Of America Na
Bought by
Kenabre Enterprises Llc
Current Estimated Value
Purchase Details
Closed on
May 22, 2014
Sold by
Gilmore Steven M
Bought by
Bank Of America Na
Purchase Details
Closed on
May 28, 2004
Sold by
Shepard Wade A and Shepard Linda S
Bought by
Gilmore Steven M
Home Financials for this Owner
Home Financials are based on the most recent Mortgage that was taken out on this home.
Original Mortgage
$80,250
Interest Rate
6.06%
Mortgage Type
FHA
Purchase Details
Closed on
May 13, 1998
Sold by
Shepard Wade A
Bought by
Shepard Wade A and Shepard Linda S
Home Financials for this Owner
Home Financials are based on the most recent Mortgage that was taken out on this home.
Original Mortgage
$67,500
Interest Rate
7.19%
Purchase Details
Closed on
Sep 1, 1992
Create a Home Valuation Report for This Property
The Home Valuation Report is an in-depth analysis detailing your home's value as well as a comparison with similar homes in the area
Home Values in the Area
Average Home Value in this Area
Purchase History
| Date | Buyer | Sale Price | Title Company |
|---|---|---|---|
| Kenabre Enterprises Llc | $25,000 | Bay National Title Co | |
| Bank Of America Na | $38,000 | None Available | |
| Gilmore Steven M | $80,900 | -- | |
| Shepard Wade A | -- | -- | |
| -- | $55,500 | -- |
Source: Public Records
Mortgage History
| Date | Status | Borrower | Loan Amount |
|---|---|---|---|
| Previous Owner | Gilmore Steven M | $80,250 | |
| Previous Owner | Shepard Wade A | $67,500 |
Source: Public Records
Tax History
| Year | Tax Paid | Tax Assessment Tax Assessment Total Assessment is a certain percentage of the fair market value that is determined by local assessors to be the total taxable value of land and additions on the property. | Land | Improvement |
|---|---|---|---|---|
| 2025 | $2,652 | $53,560 | $14,180 | $39,380 |
| 2024 | $2,652 | $53,560 | $14,180 | $39,380 |
| 2023 | $2,635 | $53,550 | $14,175 | $39,375 |
| 2022 | $1,716 | $27,650 | $6,300 | $21,350 |
| 2021 | $1,758 | $27,650 | $6,300 | $21,350 |
| 2020 | $1,762 | $27,650 | $6,300 | $21,350 |
| 2019 | $1,672 | $23,030 | $5,250 | $17,780 |
| 2018 | $1,681 | $23,030 | $5,250 | $17,780 |
| 2017 | $1,692 | $23,030 | $5,250 | $17,780 |
| 2016 | $1,682 | $20,760 | $3,920 | $16,840 |
| 2015 | $1,681 | $20,760 | $3,920 | $16,840 |
| 2014 | $1,503 | $20,760 | $3,920 | $16,840 |
| 2013 | $730 | $23,030 | $4,340 | $18,690 |
Source: Public Records
Map
Nearby Homes
- 3824 Wade Rd
- 3860 Evanston Rd
- 5189 Zimmer Dr
- 5106 Harbor Blvd
- 5408 Branchville Dr
- 5392 Glendalough St Unit 29
- 5431 Dungarven St Unit 245
- 5044 Albany Dr
- 4067 Fitzpatrick Blvd Unit 63
- 3493 Tremaine Rd
- 5508 Arklow Way Unit 117
- 5464 Rohden Dr
- 3434 Latonia Rd
- 3455 Tremaine Rd
- 4980 Harbor Blvd
- 3622 Alpena Rd
- 3333 Latonia Ct
- 5388 Town Hill Dr
- 5615 Tarboro Place
- 3246 Latonia Rd
- 3916 Signal Dr
- 3904 Signal Dr
- 3892 Signal Dr
- 3924 Signal Dr
- 3911 Signal Dr
- 3932 Signal Dr
- 3880 Signal Dr
- 3919 Signal Dr
- 3893 Signal Dr
- 3927 Signal Dr
- 3885 Signal Dr
- 3940 Signal Dr
- 3872 Signal Dr
- 3935 Signal Dr
- 3873 Signal Dr
- 3908 Clearwater Dr
- 3896 Clearwater Dr
- 3888 Clearwater Dr
- 3958 Signal Dr
- 3860 Signal Dr
Your Personal Tour Guide
Ask me questions while you tour the home.