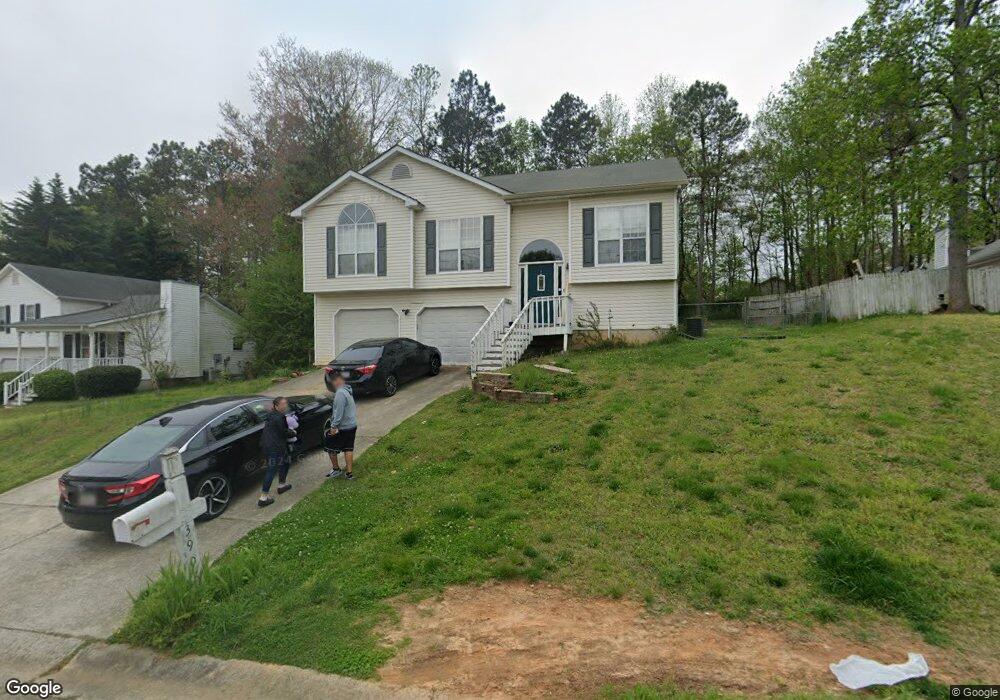
3908 Wakefield Dr Flowery Branch, GA 30542
Estimated Value: $296,000 - $347,000
3
Beds
2
Baths
1,221
Sq Ft
$265/Sq Ft
Est. Value
About This Home
This home is located at 3908 Wakefield Dr, Flowery Branch, GA 30542 and is currently estimated at $324,157, approximately $265 per square foot. 3908 Wakefield Dr is a home located in Hall County with nearby schools including Martin Elementary School, Southwest Middle School, and C.W. Davis Middle School.
Ownership History
Date
Name
Owned For
Owner Type
Purchase Details
Closed on
Jan 2, 2007
Sold by
Rodriguez Leonardo
Bought by
Rodriguez Rosario R and Rodriguez Magdaleno
Current Estimated Value
Home Financials for this Owner
Home Financials are based on the most recent Mortgage that was taken out on this home.
Original Mortgage
$119,000
Outstanding Balance
$70,479
Interest Rate
6.05%
Mortgage Type
New Conventional
Estimated Equity
$253,678
Purchase Details
Closed on
May 27, 2004
Sold by
Pass Linda D
Bought by
Rodriguez Leonardo
Home Financials for this Owner
Home Financials are based on the most recent Mortgage that was taken out on this home.
Original Mortgage
$115,386
Interest Rate
5.88%
Mortgage Type
New Conventional
Purchase Details
Closed on
Sep 18, 1997
Sold by
Garland Michael L
Bought by
Pass Linda D L
Purchase Details
Closed on
Feb 20, 1996
Sold by
Constinc Gf Wilson
Bought by
Garland Michael and Pass Linda
Purchase Details
Closed on
Oct 1, 1995
Create a Home Valuation Report for This Property
The Home Valuation Report is an in-depth analysis detailing your home's value as well as a comparison with similar homes in the area
Home Values in the Area
Average Home Value in this Area
Purchase History
| Date | Buyer | Sale Price | Title Company |
|---|---|---|---|
| Rodriguez Rosario R | $140,000 | -- | |
| Rodriguez Leonardo | $128,300 | -- | |
| Pass Linda D L | $81,300 | -- | |
| Garland Michael | $86,900 | -- | |
| -- | $16,400 | -- |
Source: Public Records
Mortgage History
| Date | Status | Borrower | Loan Amount |
|---|---|---|---|
| Open | Rodriguez Rosario R | $119,000 | |
| Previous Owner | Rodriguez Leonardo | $115,386 | |
| Closed | Garland Michael | $0 |
Source: Public Records
Tax History Compared to Growth
Tax History
| Year | Tax Paid | Tax Assessment Tax Assessment Total Assessment is a certain percentage of the fair market value that is determined by local assessors to be the total taxable value of land and additions on the property. | Land | Improvement |
|---|---|---|---|---|
| 2024 | $3,034 | $117,880 | $18,880 | $99,000 |
| 2023 | $2,755 | $106,440 | $15,720 | $90,720 |
| 2022 | $2,656 | $98,320 | $17,840 | $80,480 |
| 2021 | $2,255 | $81,160 | $8,400 | $72,760 |
| 2020 | $1,820 | $62,720 | $8,400 | $54,320 |
| 2019 | $1,754 | $59,760 | $10,280 | $49,480 |
| 2018 | $1,590 | $52,000 | $10,280 | $41,720 |
| 2017 | $1,432 | $46,920 | $10,280 | $36,640 |
| 2016 | $1,268 | $42,080 | $7,200 | $34,880 |
| 2015 | $862 | $27,029 | $6,120 | $20,909 |
| 2014 | $862 | $27,029 | $6,120 | $20,909 |
Source: Public Records
Map
Nearby Homes
- 4086 Parks Rd
- 3929 Perry Ln
- 4684 Martins Crossing Dr W
- 4020 Parks Rd
- 4838 Netherlands Place
- 4743 Amsterdam Ln
- 3582 Winder Hwy
- 3617 Winder Hwy
- 4708 Upper Berkshire Rd Unit 39
- 4021 Laurant Path
- 4013 Laurant Path
- 4016 Laurant Path
- 4054 Alderstone Dr
- 4042 Alderstone Dr
- 4050 Alderstone Dr
- Wakehurst Plan at Falls Creek
- 3935 Alderstone Dr
- Sheridan Plan at Falls Creek
- Avera Plan at Falls Creek
- 3904 Wakefield Dr
- 3912 Wakefield Dr
- 0 Wakefield Dr Unit 3212348
- 0 Wakefield Dr Unit 8987466
- 0 Wakefield Dr Unit 8034505
- 3916 Wakefield Dr
- 3907 Wakefield Dr
- 3933 Edgebrook Dr
- 3929 Edgebrook Dr
- 3911 Wakefield Dr
- 3937 Edgebrook Dr
- 3903 Wakefield Dr
- 3902 Deaton Rd
- 3906 Deaton Rd Unit 22
- 3906 Deaton Rd
- 3941 Edgebrook Dr
- 3915 Wakefield Dr
- 3920 Wakefield Dr
- 3896 Deaton Rd
- 3889 Deaton Rd