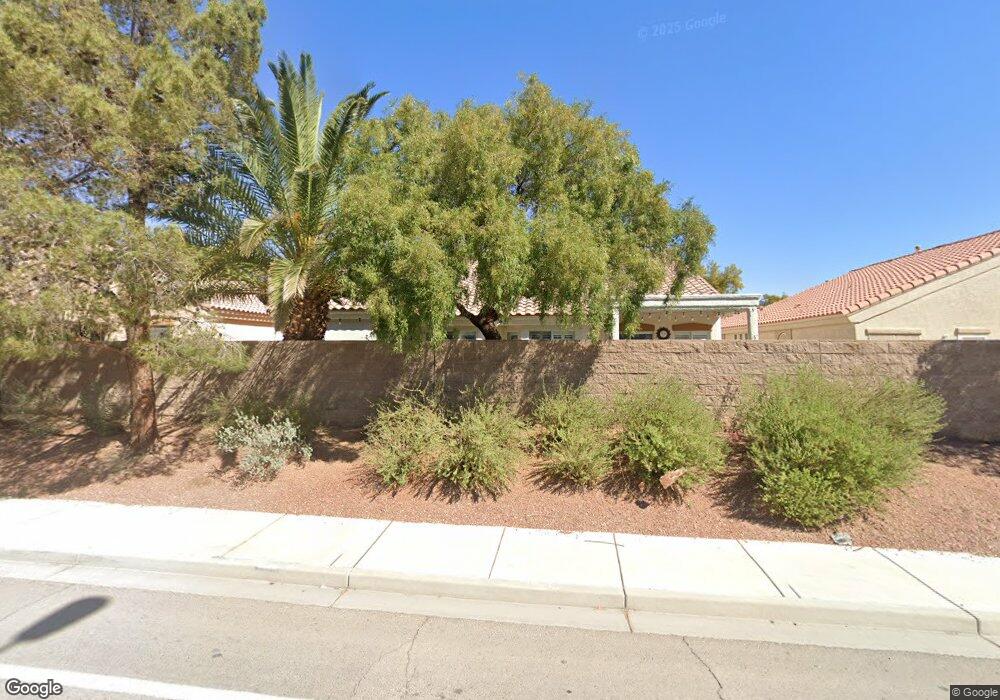
3909 Genoa Dr Las Vegas, NV 89141
Southern Highlands NeighborhoodEstimated Value: $560,822 - $649,000
3
Beds
2
Baths
2,124
Sq Ft
$294/Sq Ft
Est. Value
About This Home
This home is located at 3909 Genoa Dr, Las Vegas, NV 89141 and is currently estimated at $623,706, approximately $293 per square foot. 3909 Genoa Dr is a home located in Clark County with nearby schools including Dennis Ortwein Elementary, Lois & Jerry Tarkanian Middle School, and Desert Oasis High School.
Ownership History
Date
Name
Owned For
Owner Type
Purchase Details
Closed on
Oct 14, 2021
Sold by
Morris Richard F and Morris Joyce M
Bought by
Morris Richard F and Morris Joyce M
Current Estimated Value
Home Financials for this Owner
Home Financials are based on the most recent Mortgage that was taken out on this home.
Original Mortgage
$310,000
Outstanding Balance
$282,691
Interest Rate
2.8%
Mortgage Type
New Conventional
Estimated Equity
$341,015
Purchase Details
Closed on
Feb 15, 2018
Sold by
Lim Jenny M
Bought by
Morris Richard F and Prosser Joyce M
Home Financials for this Owner
Home Financials are based on the most recent Mortgage that was taken out on this home.
Original Mortgage
$322,065
Interest Rate
3.95%
Mortgage Type
New Conventional
Purchase Details
Closed on
Nov 22, 2017
Sold by
Burnette Jason
Bought by
Lim Jenny M
Purchase Details
Closed on
May 26, 2015
Sold by
Feaster Patricia
Bought by
Burnette Jason
Home Financials for this Owner
Home Financials are based on the most recent Mortgage that was taken out on this home.
Original Mortgage
$271,679
Interest Rate
3.64%
Mortgage Type
VA
Purchase Details
Closed on
Feb 18, 2011
Sold by
The Bank Of New York Mellon
Bought by
Feaster Maurice
Home Financials for this Owner
Home Financials are based on the most recent Mortgage that was taken out on this home.
Original Mortgage
$148,000
Interest Rate
4.9%
Mortgage Type
New Conventional
Purchase Details
Closed on
Dec 13, 2010
Sold by
Krusey Amanda K and Macdonald David A
Bought by
The Bank Of New York Mellon and The Bank Of New York
Purchase Details
Closed on
Jul 21, 2008
Sold by
Krusey Amanda K
Bought by
Macdonald David A
Purchase Details
Closed on
Apr 22, 2006
Sold by
Vance Katie E and Vance Mike
Bought by
Krusey Amanda K and Macdonald David A
Home Financials for this Owner
Home Financials are based on the most recent Mortgage that was taken out on this home.
Original Mortgage
$332,000
Interest Rate
6.12%
Mortgage Type
Unknown
Purchase Details
Closed on
Oct 31, 2002
Sold by
Vance Katie and Vance Mike
Bought by
Vance Katie
Home Financials for this Owner
Home Financials are based on the most recent Mortgage that was taken out on this home.
Original Mortgage
$198,400
Interest Rate
5.99%
Purchase Details
Closed on
May 15, 2001
Sold by
D R Horton Inc
Bought by
Bacon Katie
Home Financials for this Owner
Home Financials are based on the most recent Mortgage that was taken out on this home.
Original Mortgage
$186,550
Interest Rate
7.03%
Create a Home Valuation Report for This Property
The Home Valuation Report is an in-depth analysis detailing your home's value as well as a comparison with similar homes in the area
Home Values in the Area
Average Home Value in this Area
Purchase History
| Date | Buyer | Sale Price | Title Company |
|---|---|---|---|
| Morris Richard F | -- | First American Title Insu | |
| Morris Richard F | $372,950 | Equity Title Of Nevada | |
| Lim Jenny M | $303,000 | Equity Title Of Nevada | |
| Burnette Jason | $263,000 | Nextitle | |
| Feaster Maurice | $185,000 | Fidelity Rainbow | |
| The Bank Of New York Mellon | $171,000 | Pasion Title Services | |
| Macdonald David A | -- | None Available | |
| Krusey Amanda K | $415,000 | Equity Title Of Nevada | |
| Vance Katie | -- | Nevada Title Company | |
| Vance Mike | -- | Nevada Title Company | |
| Bacon Katie | $196,418 | United Title |
Source: Public Records
Mortgage History
| Date | Status | Borrower | Loan Amount |
|---|---|---|---|
| Open | Morris Richard F | $310,000 | |
| Closed | Morris Richard F | $322,065 | |
| Previous Owner | Burnette Jason | $271,679 | |
| Previous Owner | Feaster Maurice | $148,000 | |
| Previous Owner | Krusey Amanda K | $332,000 | |
| Previous Owner | Vance Katie | $198,400 | |
| Previous Owner | Bacon Katie | $186,550 |
Source: Public Records
Tax History Compared to Growth
Tax History
| Year | Tax Paid | Tax Assessment Tax Assessment Total Assessment is a certain percentage of the fair market value that is determined by local assessors to be the total taxable value of land and additions on the property. | Land | Improvement |
|---|---|---|---|---|
| 2025 | $2,337 | $134,450 | $50,050 | $84,400 |
| 2024 | $2,270 | $134,450 | $50,050 | $84,400 |
| 2023 | $1,852 | $120,673 | $40,950 | $79,723 |
| 2022 | $2,204 | $109,739 | $36,750 | $72,989 |
| 2021 | $2,139 | $102,676 | $33,250 | $69,426 |
| 2020 | $2,074 | $99,943 | $31,150 | $68,793 |
| 2019 | $2,014 | $96,004 | $28,350 | $67,654 |
| 2018 | $1,955 | $88,921 | $23,800 | $65,121 |
| 2017 | $2,601 | $88,670 | $22,750 | $65,920 |
| 2016 | $1,852 | $85,149 | $19,250 | $65,899 |
| 2015 | $1,848 | $65,374 | $14,000 | $51,374 |
| 2014 | $1,790 | $62,675 | $10,500 | $52,175 |
Source: Public Records
Map
Nearby Homes
- 10755 Manchester Park Dr
- 10762 Rococo Ct
- 3909 Bella Contada Ln
- 4032 Villeroy Ave
- 10727 Palliser Bay Dr
- 3792 Lodina Ct
- 3783 Lodina Ct
- 3711 Lodina Ct
- 3670 Sanucci Ct
- 3591 Bella Sovana Ct
- 4176 Demoline Cir Unit 2
- 4167 Bottiglia Ave
- 10838 Avenzano St
- 10902 Pentland Downs St
- 4185 Mita Way Unit 2
- 10852 Avenzano St
- 10921 Calcedonian St
- 10922 Fintry Hills St
- 10931 Fintry Hills St
- 10949 Fintry Hills St
- 3897 Genoa Dr
- 3921 Genoa Dr
- 3877 Genoa Dr Unit 1
- 3933 Genoa Dr
- 3904 Genoa Dr
- 3916 Genoa Dr Unit 1
- 3928 Genoa Dr Unit 1
- 3857 Genoa Dr
- 3940 Genoa Dr Unit 1
- 3901 Trapani Place Unit 1
- 10672 Piombino St
- 3881 Trapani Place
- 3929 Trapani Place
- 3952 Genoa Dr
- 3896 Villeroy Ave
- 3904 Villeroy Ave
- 3941 Trapani Place
- 3918 Villeroy Ave
- 3880 Villeroy Ave