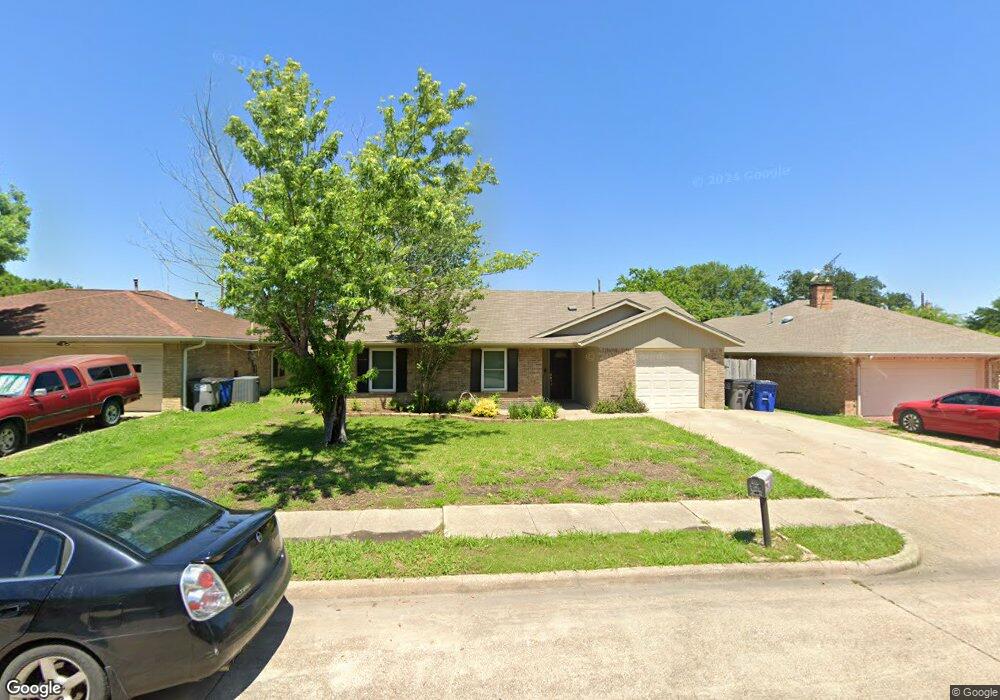
3909 Lillie St Sachse, TX 75048
Estimated Value: $271,000 - $338,000
4
Beds
2
Baths
1,674
Sq Ft
$181/Sq Ft
Est. Value
About This Home
This home is located at 3909 Lillie St, Sachse, TX 75048 and is currently estimated at $302,499, approximately $180 per square foot. 3909 Lillie St is a home located in Dallas County with nearby schools including Pinnacle Montessori of Sachse and Firewheel Christian Academy.
Ownership History
Date
Name
Owned For
Owner Type
Purchase Details
Closed on
Nov 16, 2015
Sold by
Severs Gable Suzanne
Bought by
Cole Danielle
Current Estimated Value
Home Financials for this Owner
Home Financials are based on the most recent Mortgage that was taken out on this home.
Original Mortgage
$145,712
Outstanding Balance
$114,333
Interest Rate
3.8%
Mortgage Type
FHA
Estimated Equity
$188,166
Purchase Details
Closed on
Oct 11, 2007
Sold by
Nicholson Gary and Nicholson Donna S
Bought by
Severs Gable Suzanne
Home Financials for this Owner
Home Financials are based on the most recent Mortgage that was taken out on this home.
Original Mortgage
$93,936
Interest Rate
6.48%
Mortgage Type
Purchase Money Mortgage
Purchase Details
Closed on
Mar 24, 2001
Sold by
Davis Donna S
Bought by
Nicholson Donna S
Home Financials for this Owner
Home Financials are based on the most recent Mortgage that was taken out on this home.
Original Mortgage
$72,000
Interest Rate
9.15%
Mortgage Type
Credit Line Revolving
Create a Home Valuation Report for This Property
The Home Valuation Report is an in-depth analysis detailing your home's value as well as a comparison with similar homes in the area
Home Values in the Area
Average Home Value in this Area
Purchase History
| Date | Buyer | Sale Price | Title Company |
|---|---|---|---|
| Cole Danielle | -- | Attorney | |
| Severs Gable Suzanne | -- | None Available | |
| Nicholson Donna S | -- | -- |
Source: Public Records
Mortgage History
| Date | Status | Borrower | Loan Amount |
|---|---|---|---|
| Open | Cole Danielle | $145,712 | |
| Previous Owner | Severs Gable Suzanne | $93,936 | |
| Previous Owner | Nicholson Donna S | $72,000 |
Source: Public Records
Tax History Compared to Growth
Tax History
| Year | Tax Paid | Tax Assessment Tax Assessment Total Assessment is a certain percentage of the fair market value that is determined by local assessors to be the total taxable value of land and additions on the property. | Land | Improvement |
|---|---|---|---|---|
| 2025 | $4,019 | $275,830 | $64,000 | $211,830 |
| 2024 | $4,019 | $275,830 | $64,000 | $211,830 |
| 2023 | $4,019 | $234,270 | $64,000 | $170,270 |
| 2022 | $4,033 | $234,270 | $0 | $0 |
| 2021 | $4,607 | $184,470 | $0 | $0 |
| 2020 | $4,826 | $184,470 | $40,000 | $144,470 |
| 2019 | $4,433 | $156,270 | $40,000 | $116,270 |
| 2018 | $1,946 | $156,270 | $40,000 | $116,270 |
| 2017 | $1,802 | $156,270 | $40,000 | $116,270 |
| 2016 | $4,311 | $150,100 | $20,000 | $130,100 |
| 2015 | $2,723 | $114,680 | $20,000 | $94,680 |
| 2014 | $2,723 | $114,680 | $20,000 | $94,680 |
Source: Public Records
Map
Nearby Homes
- 3917 Lillie St
- 3320 Salmon St
- 3324 Salmon St
- 3711 7th St
- 3910 7th St
- 3818 Missouri St
- 4007 William St
- 3408 Lillie St
- 3320 Bryan St
- 5937 Boone St
- 5824 Boone St
- 3117 Tina St
- 6315 Sachse St
- 4807 Sachse Rd
- 5014 Brookhollow Dr
- 6218 Dewitt St
- 3515 Harlan Dr
- 4924 Westcreek Ln
- 4818 Westcreek Ln
- 2605 Mcdearmon St