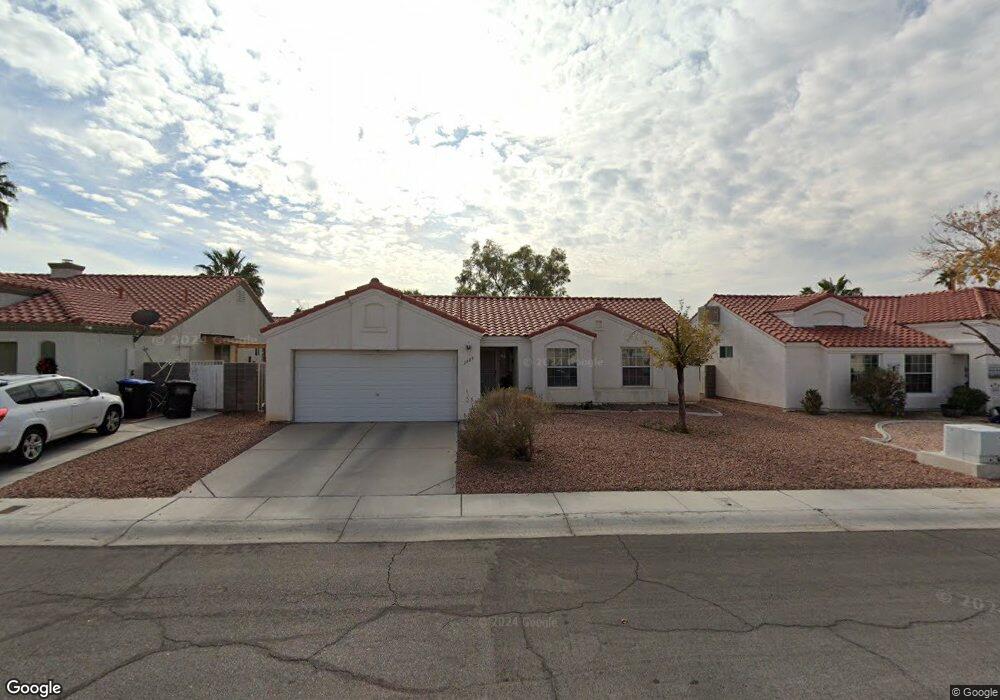
3909 Talara Ln North Las Vegas, NV 89032
Cheyenne NeighborhoodEstimated Value: $364,036 - $378,000
3
Beds
2
Baths
1,171
Sq Ft
$318/Sq Ft
Est. Value
About This Home
This home is located at 3909 Talara Ln, North Las Vegas, NV 89032 and is currently estimated at $372,259, approximately $317 per square foot. 3909 Talara Ln is a home located in Clark County with nearby schools including Lucile Bruner Elementary School, Theron L Swainston Middle School, and Cheyenne High School.
Ownership History
Date
Name
Owned For
Owner Type
Purchase Details
Closed on
Jul 29, 2024
Sold by
Brown Marie L and Brown Ava-Marie
Bought by
Ava M Brown Living Trust and Brown
Current Estimated Value
Purchase Details
Closed on
Nov 27, 1996
Sold by
Brown Rolland L and Brown Marie L
Bought by
Brown Rolland L and Brown Marie L
Home Financials for this Owner
Home Financials are based on the most recent Mortgage that was taken out on this home.
Original Mortgage
$75,500
Interest Rate
7.91%
Purchase Details
Closed on
Mar 23, 1995
Sold by
Sutton Corp
Bought by
Brown Rolland L and Brown Marie L
Home Financials for this Owner
Home Financials are based on the most recent Mortgage that was taken out on this home.
Original Mortgage
$79,880
Interest Rate
7.37%
Create a Home Valuation Report for This Property
The Home Valuation Report is an in-depth analysis detailing your home's value as well as a comparison with similar homes in the area
Home Values in the Area
Average Home Value in this Area
Purchase History
| Date | Buyer | Sale Price | Title Company |
|---|---|---|---|
| Ava M Brown Living Trust | -- | None Listed On Document | |
| Brown Rolland L | -- | United Title | |
| Brown Rolland L | $100,000 | Land Title |
Source: Public Records
Mortgage History
| Date | Status | Borrower | Loan Amount |
|---|---|---|---|
| Previous Owner | Brown Rolland L | $75,500 | |
| Previous Owner | Brown Rolland L | $79,880 |
Source: Public Records
Tax History Compared to Growth
Tax History
| Year | Tax Paid | Tax Assessment Tax Assessment Total Assessment is a certain percentage of the fair market value that is determined by local assessors to be the total taxable value of land and additions on the property. | Land | Improvement |
|---|---|---|---|---|
| 2025 | $1,541 | $72,917 | $28,000 | $44,917 |
| 2024 | $1,427 | $72,917 | $28,000 | $44,917 |
| 2023 | $1,427 | $72,578 | $29,750 | $42,828 |
| 2022 | $1,322 | $64,447 | $25,200 | $39,247 |
| 2021 | $1,224 | $59,515 | $22,050 | $37,465 |
| 2020 | $1,134 | $58,627 | $21,350 | $37,277 |
| 2019 | $1,062 | $53,590 | $16,800 | $36,790 |
| 2018 | $1,014 | $49,234 | $13,650 | $35,584 |
| 2017 | $1,635 | $48,748 | $12,600 | $36,148 |
| 2016 | $950 | $43,239 | $9,800 | $33,439 |
| 2015 | $947 | $33,616 | $7,000 | $26,616 |
| 2014 | $919 | $32,505 | $5,250 | $27,255 |
Source: Public Records
Map
Nearby Homes
- 3938 Redfield Ave
- 4013 Extenso Dr
- 4002 Extenso Dr
- 4207 Oak Bay Way
- 4115 Tatum Ct
- 4108 Dove Creek Rd
- 4230 Valley Spruce Way
- 4335 Twin Peaks Dr
- 3505 Benson Ln
- 3784 Nerine Pass Way
- 3916 Mineola Way
- 3910 Cheryl Clay Way
- 4448 Whelk Place
- 3937 Jamison Park Ln
- 3817 Dauntless Dr
- 4528 Strato Jet Way
- 3930 Burma Rd
- 3820 Alpine Track Ave
- 3804 Dauntless Dr
- 4537 Colonial Canyon St