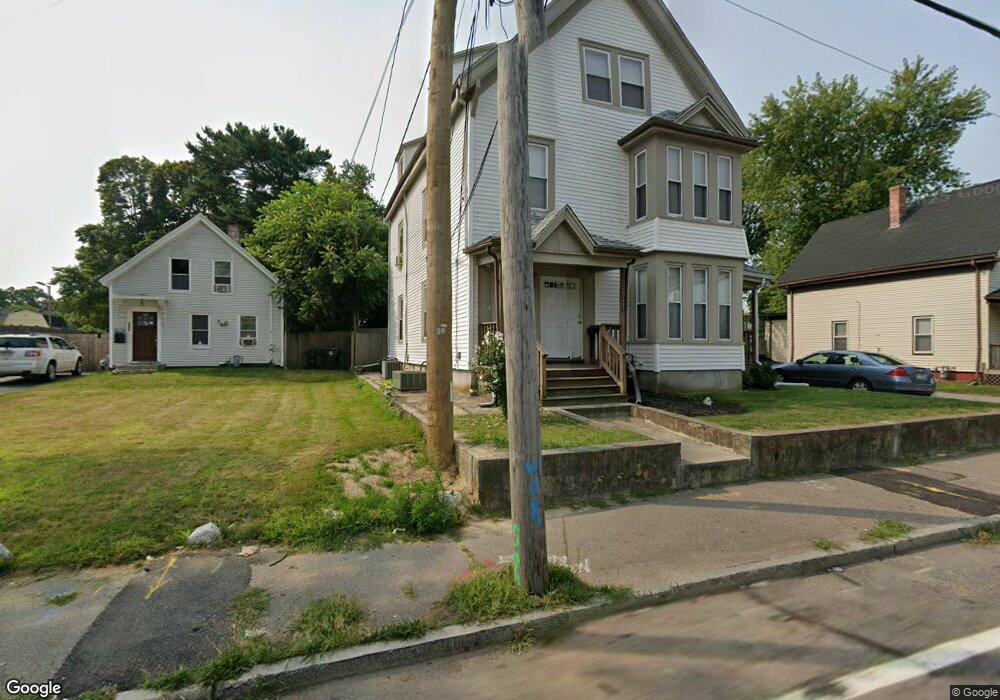
391 Centre St Brockton, MA 02302
Estimated Value: $742,000 - $858,000
9
Beds
3
Baths
3,135
Sq Ft
$250/Sq Ft
Est. Value
About This Home
This home is located at 391 Centre St, Brockton, MA 02302 and is currently estimated at $785,000, approximately $250 per square foot. 391 Centre St is a home located in Plymouth County with nearby schools including Brookfield Elementary School, Downey Elementary School, and Mary E. Baker Elementary School.
Ownership History
Date
Name
Owned For
Owner Type
Purchase Details
Closed on
Aug 30, 2023
Sold by
Alves Florencio L and Alves Maria
Bought by
Alves Florencio L and Alves Maria
Current Estimated Value
Purchase Details
Closed on
Mar 4, 1993
Sold by
Key Fin Services Inc
Bought by
Alves Florencio L
Purchase Details
Closed on
Aug 21, 1992
Sold by
Mahon John J
Bought by
Key Fincl Svcs Inc
Create a Home Valuation Report for This Property
The Home Valuation Report is an in-depth analysis detailing your home's value as well as a comparison with similar homes in the area
Purchase History
| Date | Buyer | Sale Price | Title Company |
|---|---|---|---|
| Alves Florencio L | -- | None Available | |
| Alves Florencio L | $34,500 | -- | |
| Key Fincl Svcs Inc | $88,344 | -- |
Source: Public Records
Mortgage History
| Date | Status | Borrower | Loan Amount |
|---|---|---|---|
| Previous Owner | Key Fincl Svcs Inc | $50,000 | |
| Previous Owner | Key Fincl Svcs Inc | $188,000 |
Source: Public Records
Tax History
| Year | Tax Paid | Tax Assessment Tax Assessment Total Assessment is a certain percentage of the fair market value that is determined by local assessors to be the total taxable value of land and additions on the property. | Land | Improvement |
|---|---|---|---|---|
| 2025 | $8,840 | $730,000 | $138,800 | $591,200 |
| 2024 | $8,559 | $712,100 | $138,800 | $573,300 |
| 2023 | $7,436 | $572,900 | $103,300 | $469,600 |
| 2022 | $7,178 | $513,800 | $93,900 | $419,900 |
| 2021 | $7,062 | $487,000 | $77,800 | $409,200 |
| 2020 | $6,336 | $418,200 | $73,100 | $345,100 |
| 2019 | $5,762 | $370,800 | $71,100 | $299,700 |
| 2018 | $5,794 | $360,800 | $71,100 | $289,700 |
| 2017 | $5,150 | $319,900 | $71,100 | $248,800 |
| 2016 | $4,689 | $270,100 | $68,900 | $201,200 |
| 2015 | $3,572 | $196,800 | $68,900 | $127,900 |
| 2014 | $3,695 | $203,800 | $68,900 | $134,900 |
Source: Public Records
Map
Nearby Homes
Your Personal Tour Guide
Ask me questions while you tour the home.