Estimated Value: $477,000 - $576,000
3
Beds
3
Baths
6,527
Sq Ft
$81/Sq Ft
Est. Value
About This Home
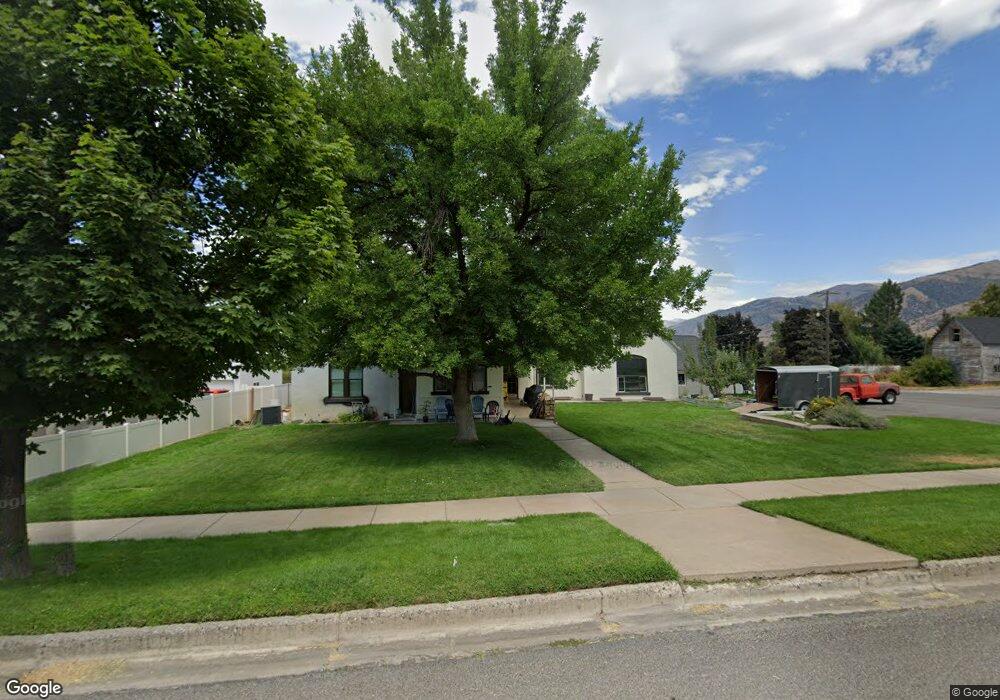
This home is located at 391 E Main St Unit 1 & 2, Hyrum, UT 84319 and is currently estimated at $528,236, approximately $80 per square foot. 391 E Main St Unit 1 & 2 is a home located in Cache County with nearby schools including Lincoln School, South Cache Middle School, and Mountain Crest High School.
Ownership History
Date
Name
Owned For
Owner Type
Purchase Details
Closed on
Mar 7, 2011
Sold by
The Secretary Of Housing & Urban Develop
Bought by
Mercado Ivan and Mercado Cindy
Current Estimated Value
Purchase Details
Closed on
Sep 19, 2008
Sold by
Wells Fargo Bank Na
Bought by
Secretary Of Housing & Urban Development
Purchase Details
Closed on
Apr 21, 2008
Sold by
South Jeffrey
Bought by
Wells Fargo Bank Na
Create a Home Valuation Report for This Property
The Home Valuation Report is an in-depth analysis detailing your home's value as well as a comparison with similar homes in the area
Home Values in the Area
Average Home Value in this Area
Purchase History
| Date | Buyer | Sale Price | Title Company |
|---|---|---|---|
| Mercado Ivan | -- | Monument Title Insurance Inc | |
| Secretary Of Housing & Urban Development | -- | Backman Title Services | |
| Wells Fargo Bank Na | $166,494 | Backman Title Services |
Source: Public Records
Tax History
| Year | Tax Paid | Tax Assessment Tax Assessment Total Assessment is a certain percentage of the fair market value that is determined by local assessors to be the total taxable value of land and additions on the property. | Land | Improvement |
|---|---|---|---|---|
| 2025 | $1,945 | $279,250 | $0 | $0 |
| 2024 | $207 | $277,795 | $0 | $0 |
| 2023 | $1,583 | $202,900 | $0 | $0 |
| 2022 | $1,616 | $198,545 | $0 | $0 |
| 2021 | $1,460 | $276,430 | $65,050 | $211,380 |
| 2020 | $1,282 | $227,650 | $65,050 | $162,600 |
| 2019 | $695 | $116,153 | $39,950 | $76,203 |
| 2018 | $669 | $107,989 | $39,950 | $68,039 |
| 2017 | $650 | $54,515 | $0 | $0 |
| 2016 | $665 | $54,515 | $0 | $0 |
| 2015 | $667 | $54,515 | $0 | $0 |
| 2014 | $584 | $48,795 | $0 | $0 |
| 2013 | $755 | $48,795 | $0 | $0 |
Source: Public Records
Map
Nearby Homes
Your Personal Tour Guide
Ask me questions while you tour the home.