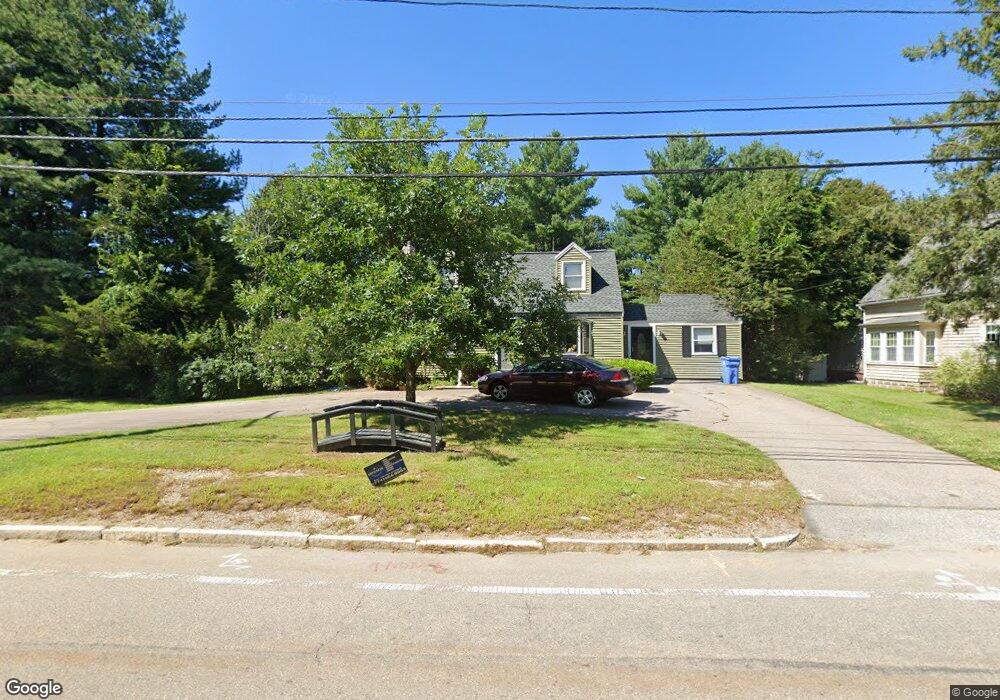
391 East St Wrentham, MA 02093
Estimated Value: $564,000 - $630,000
2
Beds
2
Baths
1,440
Sq Ft
$405/Sq Ft
Est. Value
About This Home
This home is located at 391 East St, Wrentham, MA 02093 and is currently estimated at $583,434, approximately $405 per square foot. 391 East St is a home located in Norfolk County with nearby schools including Delaney Elementary School, Charles E Roderick, and Foxborough Regional Charter School.
Ownership History
Date
Name
Owned For
Owner Type
Purchase Details
Closed on
Nov 10, 1998
Sold by
Wicklund Dawn S
Bought by
Empey Robert F and Empey Karen Y
Current Estimated Value
Home Financials for this Owner
Home Financials are based on the most recent Mortgage that was taken out on this home.
Original Mortgage
$135,000
Outstanding Balance
$29,597
Interest Rate
6.64%
Mortgage Type
Purchase Money Mortgage
Estimated Equity
$553,837
Purchase Details
Closed on
Mar 30, 1994
Sold by
Jones William D and Jones Ruth M
Bought by
Wicklund Keith G and Wicklund Dawn S
Home Financials for this Owner
Home Financials are based on the most recent Mortgage that was taken out on this home.
Original Mortgage
$138,605
Interest Rate
7.07%
Mortgage Type
Purchase Money Mortgage
Create a Home Valuation Report for This Property
The Home Valuation Report is an in-depth analysis detailing your home's value as well as a comparison with similar homes in the area
Home Values in the Area
Average Home Value in this Area
Purchase History
| Date | Buyer | Sale Price | Title Company |
|---|---|---|---|
| Empey Robert F | $182,900 | -- | |
| Wicklund Keith G | $145,900 | -- |
Source: Public Records
Mortgage History
| Date | Status | Borrower | Loan Amount |
|---|---|---|---|
| Open | Empey Robert F | $135,000 | |
| Previous Owner | Wicklund Keith G | $138,605 | |
| Previous Owner | Empey Robert F | $104,000 | |
| Previous Owner | Empey Robert F | $107,000 |
Source: Public Records
Tax History Compared to Growth
Tax History
| Year | Tax Paid | Tax Assessment Tax Assessment Total Assessment is a certain percentage of the fair market value that is determined by local assessors to be the total taxable value of land and additions on the property. | Land | Improvement |
|---|---|---|---|---|
| 2025 | $5,628 | $485,600 | $266,600 | $219,000 |
| 2024 | $5,426 | $452,200 | $266,600 | $185,600 |
| 2023 | $5,167 | $409,400 | $242,400 | $167,000 |
| 2022 | $4,914 | $359,500 | $218,200 | $141,300 |
| 2021 | $4,635 | $329,400 | $194,900 | $134,500 |
| 2020 | $4,597 | $322,600 | $177,900 | $144,700 |
| 2019 | $4,225 | $299,200 | $161,700 | $137,500 |
| 2018 | $3,990 | $280,200 | $161,900 | $118,300 |
| 2017 | $3,775 | $264,900 | $158,800 | $106,100 |
| 2016 | $3,690 | $258,400 | $154,200 | $104,200 |
| 2015 | $3,592 | $239,800 | $148,300 | $91,500 |
| 2014 | $3,534 | $230,800 | $142,600 | $88,200 |
Source: Public Records
Map
Nearby Homes
- 362 East St
- 1 Lorraine Metcalf Dr
- 270 Dedham St
- 65 Pond St
- 10 Nature View Dr
- 15 Nature View Dr
- 319 Taunton St
- 120 Hawes St
- 483 Thurston St
- 25 Foxboro Rd
- 131 Creek St Unit 7
- 11 Earle Stewart Ln
- Lot 3 - 14 Earle Stewart Ln
- Lot 1 - Blueberry 2 Car Plan at King Philip Estates
- Lot 8 - Blueberry 2 Car Plan at King Philip Estates
- Lot 5 - Hughes 2 car Plan at King Philip Estates
- Lot 6 - Blueberry 3 Car Plan at King Philip Estates
- Lot 2 - Camden 2 Car Plan at King Philip Estates
- Lot 7 - Cedar Plan at King Philip Estates
- Lot 4 - Hemingway 2 Car Plan at King Philip Estates