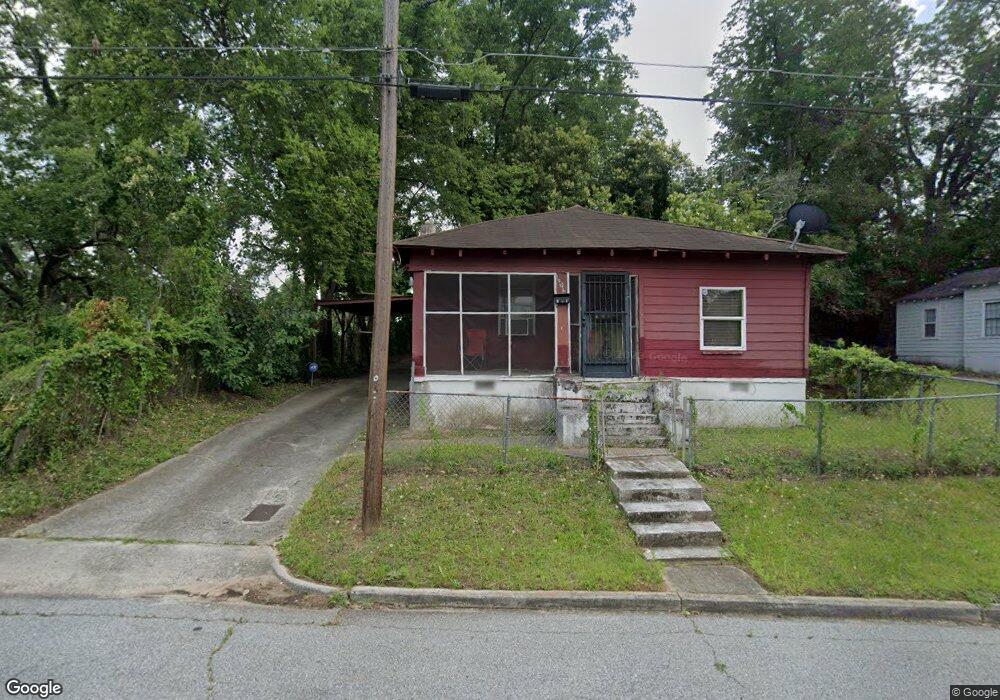
391 Fulton St Macon, GA 31217
Fort Hill Historic District NeighborhoodEstimated Value: $37,000 - $52,000
2
Beds
1
Bath
747
Sq Ft
$59/Sq Ft
Est. Value
About This Home
This home is located at 391 Fulton St, Macon, GA 31217 and is currently estimated at $44,129, approximately $59 per square foot. 391 Fulton St is a home located in Bibb County with nearby schools including Burdell Elementary School, Appling Middle School, and Northeast High School.
Ownership History
Date
Name
Owned For
Owner Type
Purchase Details
Closed on
Apr 25, 2018
Sold by
Jackson Recardo
Bought by
Smith Eric K
Current Estimated Value
Purchase Details
Closed on
Jun 20, 2015
Sold by
Slappy Patrina Reid
Bought by
Jackson Recardo
Purchase Details
Closed on
Jan 9, 2009
Sold by
Reid Darrin Bernard
Bought by
Pless Patrina Reid
Purchase Details
Closed on
Oct 28, 2008
Sold by
Reid Benjamin
Bought by
Pless Patrina Reid
Purchase Details
Closed on
Oct 3, 2008
Sold by
Griggs Yvonne Reid
Bought by
Pless Patrina Reid
Create a Home Valuation Report for This Property
The Home Valuation Report is an in-depth analysis detailing your home's value as well as a comparison with similar homes in the area
Home Values in the Area
Average Home Value in this Area
Purchase History
| Date | Buyer | Sale Price | Title Company |
|---|---|---|---|
| Smith Eric K | $8,500 | None Available | |
| Jackson Recardo | $2,000 | -- | |
| Pless Patrina Reid | -- | None Available | |
| Pless Patrina Reid | -- | None Available | |
| Pless Patrina Reid | -- | None Available | |
| Pless Patrina Reid | -- | None Available | |
| Pless Patrina Reid | -- | None Available | |
| Pless Patrina Reid | -- | None Available | |
| Pless Patrina Reid | -- | None Available |
Source: Public Records
Tax History Compared to Growth
Tax History
| Year | Tax Paid | Tax Assessment Tax Assessment Total Assessment is a certain percentage of the fair market value that is determined by local assessors to be the total taxable value of land and additions on the property. | Land | Improvement |
|---|---|---|---|---|
| 2025 | $215 | $8,735 | $2,200 | $6,535 |
| 2024 | $180 | $7,097 | $1,200 | $5,897 |
| 2023 | $175 | $6,897 | $1,000 | $5,897 |
| 2022 | $173 | $5,009 | $1,462 | $3,547 |
| 2021 | $117 | $3,079 | $548 | $2,531 |
| 2020 | $110 | $2,836 | $548 | $2,288 |
| 2019 | $102 | $2,592 | $548 | $2,044 |
| 2018 | $335 | $2,592 | $548 | $2,044 |
| 2017 | $97 | $2,592 | $548 | $2,044 |
| 2016 | $28 | $2,592 | $548 | $2,044 |
| 2015 | $114 | $2,332 | $548 | $1,784 |
| 2014 | $159 | $2,814 | $585 | $2,230 |
Source: Public Records
Map
Nearby Homes
- 378 Cowan St
- 390 Cowan St
- 363 Woolfolk St Unit 361 Woolfolk Street
- 363 AND 361 Woolfolk St
- 842 Little Short St
- 970 Center St
- 990 Center St
- 658 Pringle St
- 734 Fort Hill St
- 845 N Garden Terrace
- 846 N Garden Terrace
- 348 Woolfolk St
- 521 Church St
- 508 Willingham Ct
- 506 Willingham Ct
- 760 Cowan St
- 738 Hall St
- 768 Maynard St
- 727 Smith St
- 722 Mitchell St