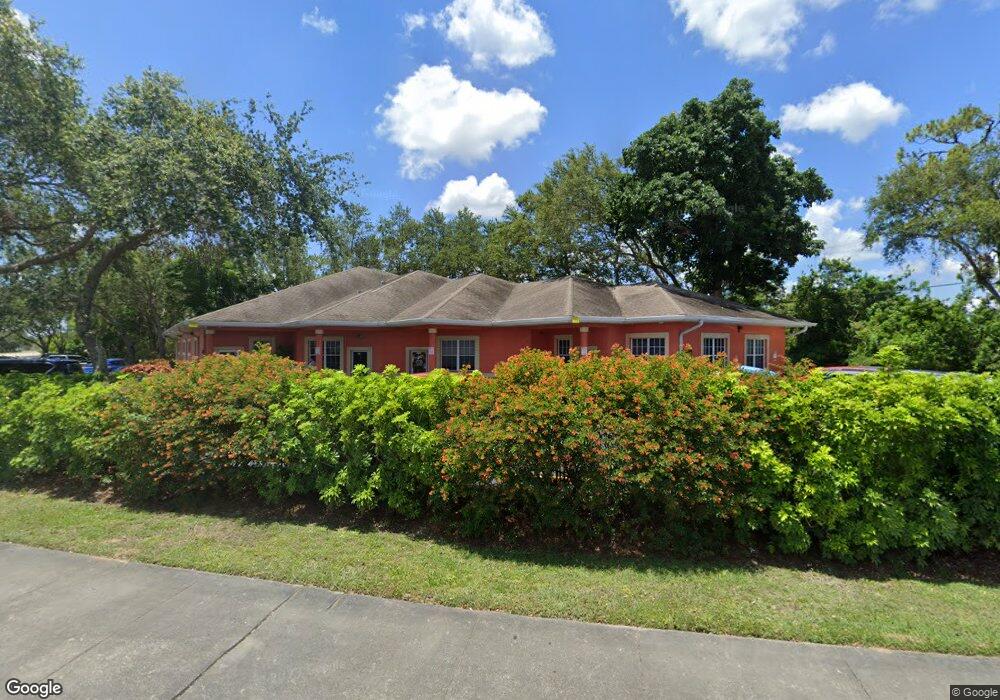
391 Lee Blvd Unit 200A Lehigh Acres, FL 33936
Richmond NeighborhoodEstimated Value: $1,340,765
--
Bed
18
Baths
8,593
Sq Ft
$156/Sq Ft
Est. Value
About This Home
This home is located at 391 Lee Blvd Unit 200A, Lehigh Acres, FL 33936 and is currently estimated at $1,340,765, approximately $156 per square foot. 391 Lee Blvd Unit 200A is a home located in Lee County with nearby schools including Lehigh Elementary School, Gateway Elementary School, and The Alva School.
Ownership History
Date
Name
Owned For
Owner Type
Purchase Details
Closed on
Dec 26, 2017
Sold by
Toro Elmer F
Bought by
Personal Family Health Care Inc
Current Estimated Value
Purchase Details
Closed on
Oct 27, 2010
Sold by
Ritzel Linda L
Bought by
Toro Elmer F
Home Financials for this Owner
Home Financials are based on the most recent Mortgage that was taken out on this home.
Original Mortgage
$437,600
Interest Rate
4.37%
Mortgage Type
Commercial
Purchase Details
Closed on
Apr 25, 2005
Sold by
Ritzert Linda L
Bought by
Ritzert Linda L and The Linda L Ritzert Trust
Purchase Details
Closed on
Apr 30, 2001
Sold by
B C H Development Inc
Bought by
Ritzert Karl J
Home Financials for this Owner
Home Financials are based on the most recent Mortgage that was taken out on this home.
Original Mortgage
$196,465
Interest Rate
6.9%
Mortgage Type
Commercial
Create a Home Valuation Report for This Property
The Home Valuation Report is an in-depth analysis detailing your home's value as well as a comparison with similar homes in the area
Home Values in the Area
Average Home Value in this Area
Purchase History
| Date | Buyer | Sale Price | Title Company |
|---|---|---|---|
| Personal Family Health Care Inc | $250,000 | Attorney | |
| Toro Elmer F | $440,000 | Ocean Title Insurance Agency | |
| Ritzert Linda L | -- | -- | |
| Ritzert Karl J | $550,000 | -- |
Source: Public Records
Mortgage History
| Date | Status | Borrower | Loan Amount |
|---|---|---|---|
| Previous Owner | Toro Elmer F | $437,600 | |
| Previous Owner | Ritzert Karl J | $196,465 |
Source: Public Records
Tax History Compared to Growth
Tax History
| Year | Tax Paid | Tax Assessment Tax Assessment Total Assessment is a certain percentage of the fair market value that is determined by local assessors to be the total taxable value of land and additions on the property. | Land | Improvement |
|---|---|---|---|---|
| 2025 | $12,669 | $626,985 | -- | -- |
| 2024 | $11,384 | $569,986 | -- | -- |
| 2023 | $11,384 | $518,169 | $0 | $0 |
| 2022 | $10,086 | $471,063 | $0 | $0 |
| 2021 | $8,788 | $854,121 | $62,274 | $791,847 |
| 2020 | $6,129 | $431,040 | $24,765 | $406,275 |
| 2019 | $8,525 | $353,916 | $20,045 | $333,871 |
| 2018 | $8,634 | $359,188 | $20,999 | $338,189 |
| 2017 | $8,211 | $332,948 | $23,628 | $309,320 |
| 2016 | $8,177 | $331,903 | $28,942 | $302,961 |
| 2015 | $7,979 | $320,263 | $37,984 | $282,279 |
| 2014 | -- | $334,306 | $35,907 | $298,399 |
| 2013 | -- | $334,787 | $53,979 | $280,808 |
Source: Public Records
Map
Nearby Homes
- 702 Monroe Ave
- 603 Jefferson Dr
- 515 York Rd
- 503 Lincoln Blvd
- 1001 Coolidge Ave
- 1101 Coolidge Ave
- 339 Beachwood Rd
- 506 York Rd
- 111 Connecticut Rd
- 1208 Barnsdale St
- 703 Coolidge Ave
- 706 Coolidge Ave
- 111 Oregon Rd N
- 320 Lincoln Blvd
- 506 W 5th St
- 314 Vermont Way
- 106 Stetson St
- 710 Fillmore Ave
- 505 Palmetto Ave
- 105 Oregon Rd N
- 391 Lee Blvd Unit 400
- 391 Lee Blvd Unit 100
- 703 Taylor Ln
- 306 Maine Place
- 304 Maine Place
- 308 Maine Place
- 302 Maine Place
- 411 Lee Blvd
- 302 Lee Blvd
- 302 Lee Blvd Unit 101
- 801 Taylor Ln
- 410 Lee Blvd
- 430 Lee Blvd
- 311 Maine Place Unit 11
- 313 Maine Place
- 309 Maine Place
- 315 Maine Place
- 800 Taylor Ln
- 307 Maine Place
- 317 Maine Place