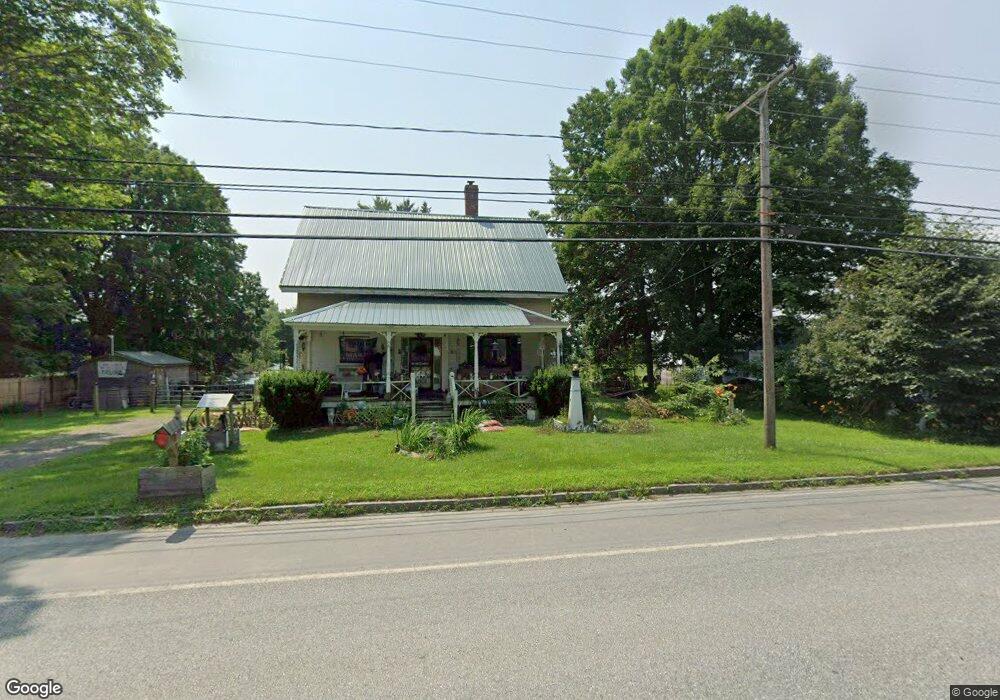
391 Main St Corinth, ME 04427
Estimated Value: $157,000 - $274,000
3
Beds
2
Baths
840
Sq Ft
$245/Sq Ft
Est. Value
About This Home
This home is located at 391 Main St, Corinth, ME 04427 and is currently estimated at $205,912, approximately $245 per square foot. 391 Main St is a home located in Penobscot County with nearby schools including Central Community Elementary School, Central High School, and Highview Christian Academy.
Ownership History
Date
Name
Owned For
Owner Type
Purchase Details
Closed on
Feb 20, 2018
Sold by
Royal River Llc
Bought by
Johnson Rodney and Johnson Sylvia
Current Estimated Value
Purchase Details
Closed on
May 4, 2017
Sold by
Northeastern Financial
Bought by
Royal River Llc
Purchase Details
Closed on
Jun 13, 2014
Sold by
Soon Partners Llc
Bought by
Mcallister Sheila
Purchase Details
Closed on
May 5, 2014
Sold by
Corinth Town Of
Bought by
Soon Partners Llc
Purchase Details
Closed on
Mar 14, 2011
Sold by
E H Pooled 1010 Lp
Bought by
Northeastern Fin Llc
Purchase Details
Closed on
Jun 21, 2010
Sold by
Downing Jennifer
Bought by
Us Bank Na and J P Morgan Mtg Acq Corp
Create a Home Valuation Report for This Property
The Home Valuation Report is an in-depth analysis detailing your home's value as well as a comparison with similar homes in the area
Home Values in the Area
Average Home Value in this Area
Purchase History
| Date | Buyer | Sale Price | Title Company |
|---|---|---|---|
| Johnson Rodney | -- | None Available | |
| Johnson Rodney | -- | None Available | |
| Royal River Llc | -- | -- | |
| Northeastern Financial | -- | -- | |
| Mcallister Sheila | -- | -- | |
| Soon Partners Llc | -- | -- | |
| Northeastern Fin Llc | $15,405 | -- | |
| Us Bank Na | -- | -- | |
| Us Bank Na | -- | -- |
Source: Public Records
Tax History
| Year | Tax Paid | Tax Assessment Tax Assessment Total Assessment is a certain percentage of the fair market value that is determined by local assessors to be the total taxable value of land and additions on the property. | Land | Improvement |
|---|---|---|---|---|
| 2024 | $1,243 | $92,100 | $25,900 | $66,200 |
| 2023 | $1,199 | $89,800 | $25,100 | $64,700 |
| 2022 | $1,176 | $69,200 | $18,100 | $51,100 |
| 2021 | $1,176 | $69,200 | $18,100 | $51,100 |
| 2020 | $1,107 | $69,200 | $18,100 | $51,100 |
| 2019 | $1,047 | $66,690 | $17,060 | $49,630 |
| 2018 | $1,075 | $67,630 | $17,060 | $50,570 |
| 2017 | $1,042 | $65,130 | $17,060 | $48,070 |
| 2016 | $1,023 | $65,130 | $17,060 | $48,070 |
| 2015 | $957 | $65,130 | $17,060 | $48,070 |
| 2014 | $951 | $65,130 | $17,060 | $48,070 |
| 2013 | $905 | $65,130 | $17,060 | $48,070 |
Source: Public Records
Map
Nearby Homes
Your Personal Tour Guide
Ask me questions while you tour the home.