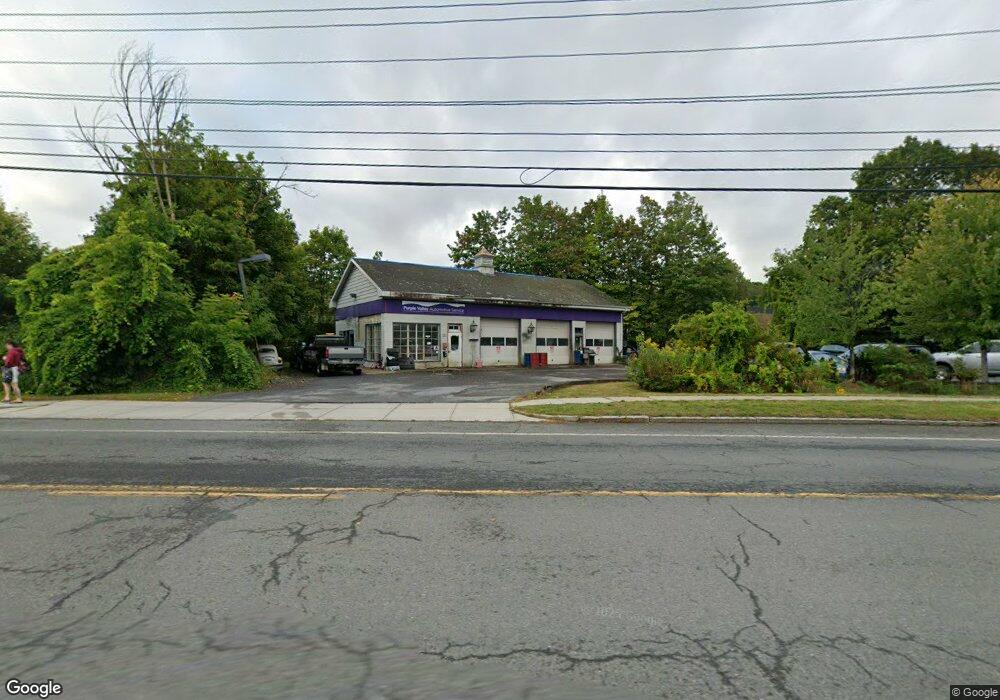
391 Main St Williamstown, MA 01267
Estimated Value: $751,080
--
Bed
--
Bath
1,800
Sq Ft
$417/Sq Ft
Est. Value
About This Home
This home is located at 391 Main St, Williamstown, MA 01267 and is currently estimated at $751,080, approximately $417 per square foot. 391 Main St is a home located in Berkshire County with nearby schools including Williamstown Elementary School, Lanesborough Elementary School, and Mt. Greylock Regional High School.
Ownership History
Date
Name
Owned For
Owner Type
Purchase Details
Closed on
Oct 16, 2008
Sold by
Power Test Realty Co L
Bought by
Lovett Ft Llc
Current Estimated Value
Home Financials for this Owner
Home Financials are based on the most recent Mortgage that was taken out on this home.
Original Mortgage
$247,500
Outstanding Balance
$164,424
Interest Rate
6.41%
Mortgage Type
Commercial
Estimated Equity
$586,656
Create a Home Valuation Report for This Property
The Home Valuation Report is an in-depth analysis detailing your home's value as well as a comparison with similar homes in the area
Home Values in the Area
Average Home Value in this Area
Purchase History
| Date | Buyer | Sale Price | Title Company |
|---|---|---|---|
| Lovett Ft Llc | $335,000 | -- |
Source: Public Records
Mortgage History
| Date | Status | Borrower | Loan Amount |
|---|---|---|---|
| Open | Lovett Ft Llc | $247,500 |
Source: Public Records
Tax History Compared to Growth
Tax History
| Year | Tax Paid | Tax Assessment Tax Assessment Total Assessment is a certain percentage of the fair market value that is determined by local assessors to be the total taxable value of land and additions on the property. | Land | Improvement |
|---|---|---|---|---|
| 2025 | $4,671 | $338,500 | $201,700 | $136,800 |
| 2024 | $4,880 | $322,100 | $180,200 | $141,900 |
| 2023 | $4,723 | $292,100 | $180,200 | $111,900 |
| 2022 | $4,284 | $253,200 | $173,500 | $79,700 |
| 2021 | $4,380 | $253,200 | $173,500 | $79,700 |
| 2020 | $4,358 | $247,600 | $174,000 | $73,600 |
| 2019 | $4,368 | $242,000 | $140,500 | $101,500 |
| 2018 | $4,341 | $242,000 | $140,500 | $101,500 |
| 2017 | $4,124 | $242,000 | $140,500 | $101,500 |
| 2016 | $3,821 | $242,000 | $140,500 | $101,500 |
| 2015 | $3,778 | $242,000 | $140,500 | $101,500 |
| 2014 | $3,832 | $250,800 | $148,700 | $102,100 |
Source: Public Records
Map
Nearby Homes
- 46 Cobble View Rd
- 15 Orchard Ln
- 14 Orchard Ln
- 51 Colonial Ave
- 108 Berkshire Dr
- 217 Main St
- 189 Stratton Rd Unit E2
- 189 Stratton Rd Unit E3
- 0 Holly Ln
- 16 Windflower Way
- 5 Windflower Way
- 2 River Run
- 2 River Run Rd
- 1 River Run Unit 1
- 12 River Run
- 160 Water St Unit 102
- 160 Water St Unit 407
- 160 Water St Unit 112
- 160 Water St Unit 23
- 160 Water St Unit 103