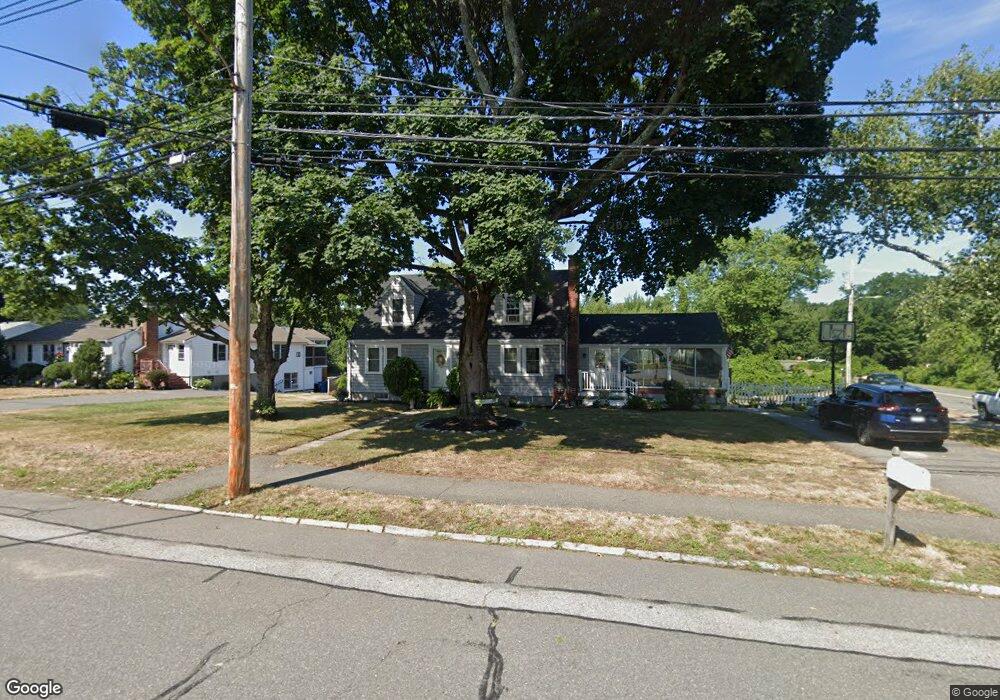
391 Maple St Danvers, MA 01923
Danvers AreaEstimated Value: $648,000 - $804,000
About This Home
This home is located at 391 Maple St, Danvers, MA 01923 and is currently estimated at $764,528, approximately $450 per square foot. 391 Maple St is a home located in Essex County with nearby schools including Danvers High School, St. Mary of the Annunciation School, and Plumfield Academy.
Ownership History
We collect this data history from publicly available records. To have your information removed, we recommend requesting removal directly through your county’s website.
Purchase Details
Purchase Details
Home Values in the Area
Average Home Value in this Area
Purchase History
We collect this data history from publicly available records. To have your information removed, we recommend requesting removal directly through your county’s website.
| Date | Buyer | Sale Price | Title Company |
|---|---|---|---|
| $303,500 | -- | ||
| -- | -- |
Mortgage History
We collect this data history from publicly available records. To have your information removed, we recommend requesting removal directly through your county’s website.
| Date | Status | Borrower | Loan Amount |
|---|---|---|---|
| Open | $297,243 |
Tax History
We collect this data history from publicly available records. To have your information removed, we recommend requesting removal directly through your county’s website.
| Year | Tax Paid | Tax Assessment Tax Assessment Total Assessment is a certain percentage of the fair market value that is determined by local assessors to be the total taxable value of land and additions on the property. | Land | Improvement |
|---|---|---|---|---|
| 2025 | $6,912 | $628,900 | $390,600 | $238,300 |
| 2024 | $6,906 | $621,600 | $390,600 | $231,000 |
| 2023 | $6,587 | $560,600 | $354,900 | $205,700 |
| 2022 | $6,567 | $518,700 | $322,000 | $196,700 |
| 2021 | $6,340 | $474,900 | $305,100 | $169,800 |
| 2020 | $6,119 | $468,500 | $301,500 | $167,000 |
| 2019 | $5,818 | $438,100 | $274,100 | $164,000 |
| 2018 | $5,696 | $420,700 | $271,300 | $149,400 |
| 2017 | $5,358 | $377,600 | $237,100 | $140,500 |
| 2016 | $5,143 | $362,200 | $226,100 | $136,100 |
| 2015 | $5,080 | $340,700 | $205,600 | $135,100 |
Map
- 100 Kirkbride Dr Unit 109
- 320 Newbury St Unit 103
- 9 College Pond Dr
- 6 Briarwood Dr
- 236 Maple St
- 9 Preston St
- 217 Maple St
- 18 Strawberry Hill Ln
- 146 Hobart St
- 14 D'Orlando Way Unit 14
- 33 North St
- 129 Hobart St
- 16 Beaver Park
- 98 Newbury St Unit 18B
- 98 Newbury St Unit 2B
- 98 Newbury St Unit 23B
- 9 Graystone Dr
- 96 Newbury St Unit 10B
- 96 Newbury St Unit 9b
- 200 North St
Ask me questions while you tour the home.