Estimated Value: $346,000 - $401,386
4
Beds
3
Baths
2,642
Sq Ft
$140/Sq Ft
Est. Value
About This Home
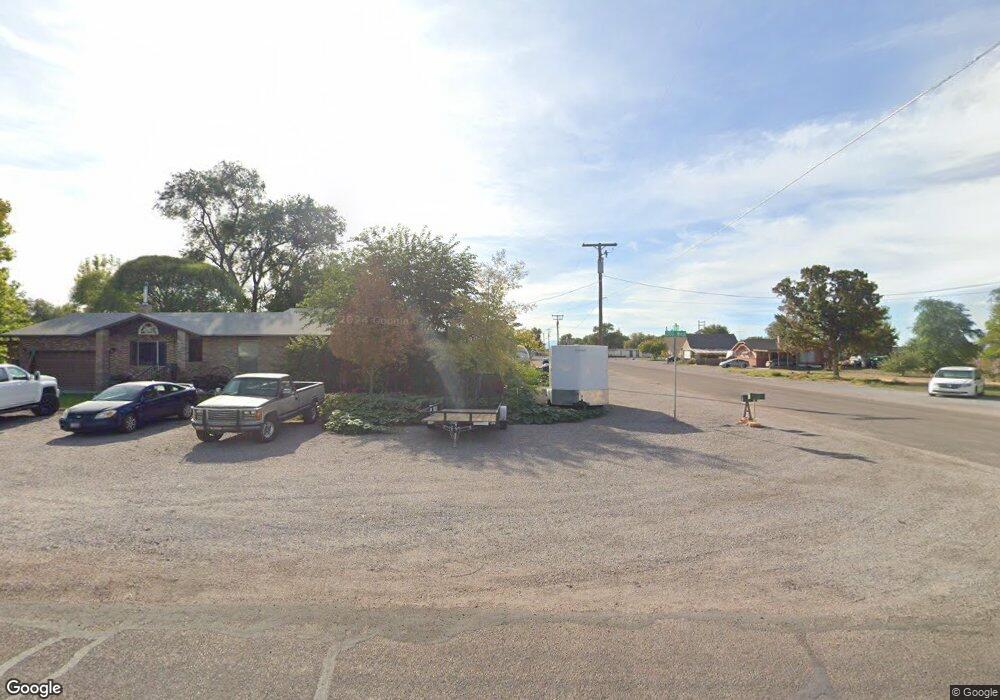
This home is located at 391 N 200 W, Delta, UT 84624 and is currently estimated at $368,847, approximately $139 per square foot. 391 N 200 W is a home located in Millard County.
Ownership History
Date
Name
Owned For
Owner Type
Purchase Details
Closed on
Apr 24, 2021
Sold by
Anderson Karl
Bought by
Anderson Karl and Anderson Becky
Current Estimated Value
Home Financials for this Owner
Home Financials are based on the most recent Mortgage that was taken out on this home.
Original Mortgage
$134,500
Outstanding Balance
$121,174
Interest Rate
3%
Mortgage Type
New Conventional
Estimated Equity
$247,673
Purchase Details
Closed on
Feb 1, 2005
Sold by
Curtis Bryant
Bought by
Anderson Karl
Home Financials for this Owner
Home Financials are based on the most recent Mortgage that was taken out on this home.
Original Mortgage
$118,750
Interest Rate
5.81%
Mortgage Type
New Conventional
Create a Home Valuation Report for This Property
The Home Valuation Report is an in-depth analysis detailing your home's value as well as a comparison with similar homes in the area
Home Values in the Area
Average Home Value in this Area
Purchase History
| Date | Buyer | Sale Price | Title Company |
|---|---|---|---|
| Anderson Karl | -- | Solidifi Title Agency Of Uta | |
| Anderson Karl | -- | First American Title Insuran |
Source: Public Records
Mortgage History
| Date | Status | Borrower | Loan Amount |
|---|---|---|---|
| Open | Anderson Karl | $134,500 | |
| Closed | Anderson Karl | $118,750 |
Source: Public Records
Tax History Compared to Growth
Tax History
| Year | Tax Paid | Tax Assessment Tax Assessment Total Assessment is a certain percentage of the fair market value that is determined by local assessors to be the total taxable value of land and additions on the property. | Land | Improvement |
|---|---|---|---|---|
| 2025 | $2,103 | $224,982 | $18,219 | $206,763 |
| 2024 | $2,103 | $192,187 | $8,716 | $183,471 |
| 2023 | $2,406 | $192,187 | $8,716 | $183,471 |
| 2022 | $1,821 | $136,996 | $7,924 | $129,072 |
| 2021 | $1,563 | $112,255 | $6,890 | $105,365 |
| 2020 | $1,259 | $89,832 | $6,264 | $83,568 |
| 2019 | $1,099 | $78,517 | $5,800 | $72,717 |
| 2018 | $1,007 | $72,513 | $5,800 | $66,713 |
| 2017 | $1,043 | $72,344 | $5,631 | $66,713 |
| 2016 | $1,011 | $72,344 | $5,631 | $66,713 |
| 2015 | $1,010 | $72,344 | $5,631 | $66,713 |
| 2014 | -- | $72,212 | $5,631 | $66,581 |
| 2013 | -- | $72,212 | $5,631 | $66,581 |
Source: Public Records
Map
Nearby Homes