Estimated Value: $375,000 - $382,000
Studio
--
Bath
--
Sq Ft
11,326
Sq Ft Lot
About This Home
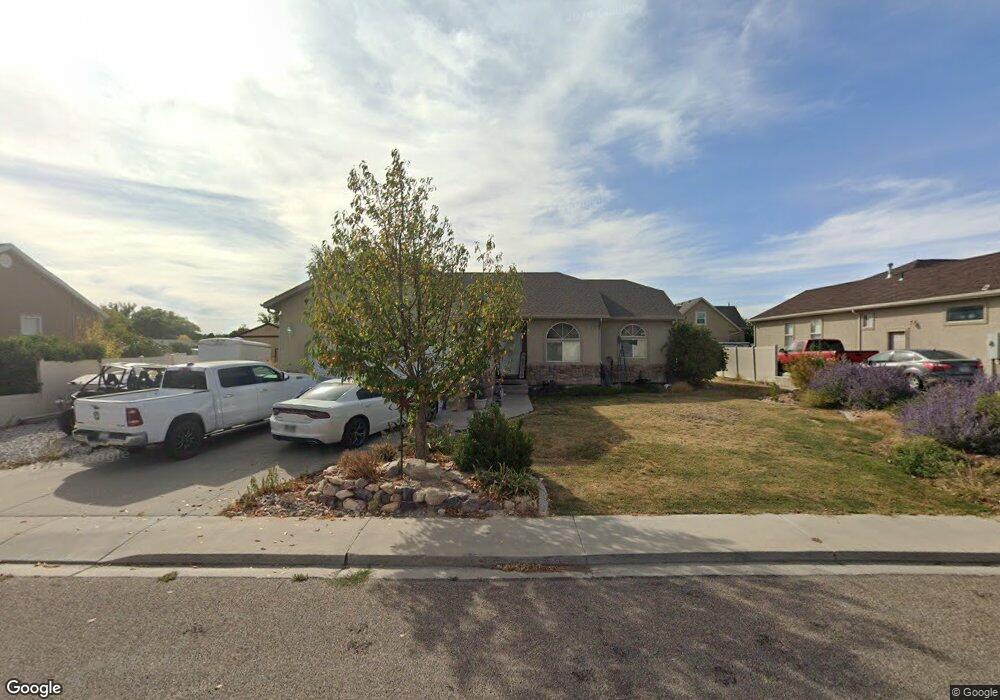
This home is located at 391 N 490 E, Delta, UT 84624 and is currently estimated at $378,500. 391 N 490 E is a home with nearby schools including Cba Center and White River Academy.
Ownership History
Date
Name
Owned For
Owner Type
Purchase Details
Closed on
May 31, 2013
Sold by
Styler Kristan A
Bought by
Styler Kristan A and Meinhardt Carol
Current Estimated Value
Home Financials for this Owner
Home Financials are based on the most recent Mortgage that was taken out on this home.
Original Mortgage
$135,200
Outstanding Balance
$94,782
Interest Rate
3.32%
Mortgage Type
New Conventional
Estimated Equity
$283,718
Purchase Details
Closed on
Nov 9, 2005
Sold by
Winters Chad A and Winters Meladie M
Bought by
Styler John R and Styler Kristan A
Home Financials for this Owner
Home Financials are based on the most recent Mortgage that was taken out on this home.
Original Mortgage
$31,000
Interest Rate
5.93%
Mortgage Type
New Conventional
Purchase Details
Closed on
Feb 16, 2005
Sold by
Binker Gayle and Bunker Gayle K
Bought by
Winters Chad A and Winters Meladie M
Home Financials for this Owner
Home Financials are based on the most recent Mortgage that was taken out on this home.
Original Mortgage
$120,620
Interest Rate
5.73%
Create a Home Valuation Report for This Property
The Home Valuation Report is an in-depth analysis detailing your home's value as well as a comparison with similar homes in the area
Home Values in the Area
Average Home Value in this Area
Purchase History
| Date | Buyer | Sale Price | Title Company |
|---|---|---|---|
| Styler Kristan A | -- | -- | |
| Styler Kristan A | -- | -- | |
| Styler John R | -- | -- | |
| Winters Chad A | -- | First American Title Insuran |
Source: Public Records
Mortgage History
| Date | Status | Borrower | Loan Amount |
|---|---|---|---|
| Open | Styler Kristan A | $135,200 | |
| Previous Owner | Styler John R | $31,000 | |
| Previous Owner | Styler John R | $124,000 | |
| Previous Owner | Winters Chad A | $120,620 |
Source: Public Records
Tax History
| Year | Tax Paid | Tax Assessment Tax Assessment Total Assessment is a certain percentage of the fair market value that is determined by local assessors to be the total taxable value of land and additions on the property. | Land | Improvement |
|---|---|---|---|---|
| 2025 | $2,081 | $222,612 | $16,713 | $205,899 |
| 2024 | $2,081 | $191,033 | $14,981 | $176,052 |
| 2023 | $2,367 | $191,033 | $14,981 | $176,052 |
| 2022 | $1,805 | $135,792 | $13,619 | $122,173 |
| 2021 | $1,553 | $111,576 | $11,843 | $99,733 |
| 2020 | $1,446 | $103,227 | $10,766 | $92,461 |
| 2019 | $1,327 | $94,816 | $10,453 | $84,363 |
| 2018 | $1,256 | $90,461 | $10,453 | $80,008 |
| 2017 | $1,304 | $90,461 | $10,453 | $80,008 |
| 2016 | $1,264 | $90,461 | $10,453 | $80,008 |
| 2015 | $1,119 | $80,164 | $10,453 | $69,711 |
| 2014 | -- | $78,633 | $10,453 | $68,180 |
| 2013 | -- | $78,633 | $10,453 | $68,180 |
Source: Public Records
Map
Nearby Homes
- 520 E 450 North Rd
- 7900 E 250 Rd N
- 628 Sunset St
- 445 Topaz Blvd Unit 10
- 901 E 750 Rd N
- 44 E 300 S
- 0 E Highway 6 Unit LotWP001 16586023
- 87 S 300 East Rd
- Locust Ave Unit LotWP001
- 321 E 200 S
- 325 N 100 W
- 648 Tamarix St
- 700 N Highway 6
- 38 E 300 S
- 32 E 300 S
- 163 W 100 S
- 98 W 1000 N
- 7430 W 3000 N
- 451 W 300 N
- 341 W 100 S
Your Personal Tour Guide
Ask me questions while you tour the home.