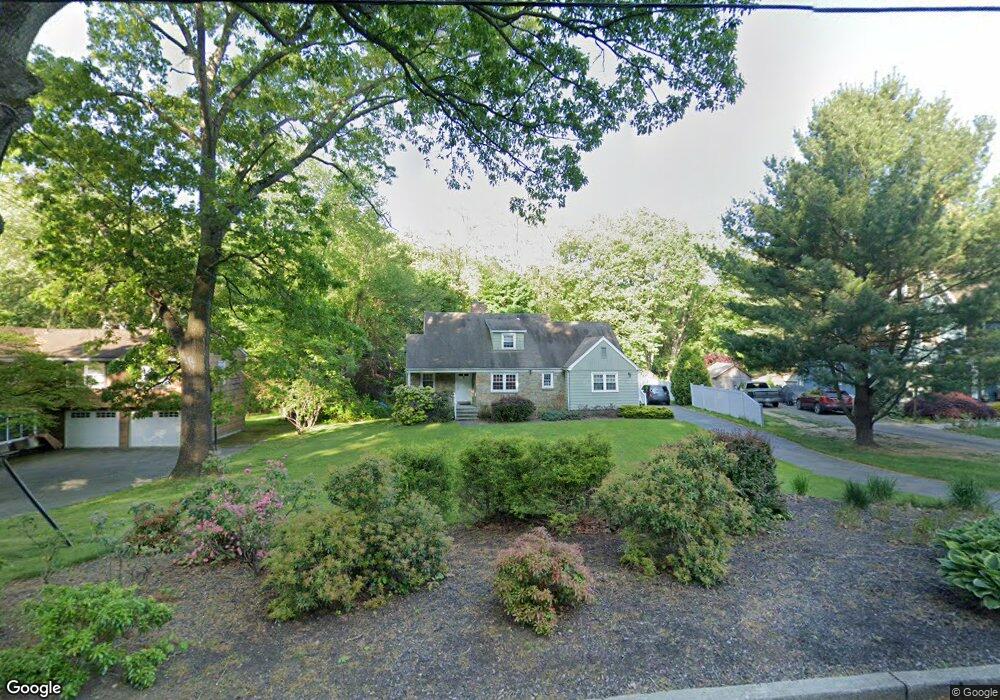
391 Nonopoge Rd Fairfield, CT 06825
Lake Mohegan Hills NeighborhoodEstimated Value: $812,000 - $991,000
4
Beds
3
Baths
1,917
Sq Ft
$462/Sq Ft
Est. Value
About This Home
This home is located at 391 Nonopoge Rd, Fairfield, CT 06825 and is currently estimated at $886,389, approximately $462 per square foot. 391 Nonopoge Rd is a home located in Fairfield County with nearby schools including North Stratfield Elementary School, Fairfield Woods Middle School, and Fairfield Warde High School.
Ownership History
Date
Name
Owned For
Owner Type
Purchase Details
Closed on
Sep 8, 2006
Sold by
Lomotan Edwin A and Lomotan Kathy N
Bought by
Imschweiler Frank M and Imschweiler Kelly I
Current Estimated Value
Home Financials for this Owner
Home Financials are based on the most recent Mortgage that was taken out on this home.
Original Mortgage
$600,000
Outstanding Balance
$358,952
Interest Rate
6.79%
Estimated Equity
$527,437
Purchase Details
Closed on
Apr 15, 2004
Sold by
Land America Onestop I
Bought by
Lovotan Edwin A and Lovotan Kathy N
Home Financials for this Owner
Home Financials are based on the most recent Mortgage that was taken out on this home.
Original Mortgage
$428,000
Interest Rate
5.58%
Purchase Details
Closed on
Feb 15, 2002
Sold by
Remeika Michael and Remeika Beth A
Bought by
Lampkin Stephen A and Lampkin Renata G
Purchase Details
Closed on
Sep 28, 2001
Sold by
Mojcher June A
Bought by
Remeika Michael and Remeika Beth A
Create a Home Valuation Report for This Property
The Home Valuation Report is an in-depth analysis detailing your home's value as well as a comparison with similar homes in the area
Home Values in the Area
Average Home Value in this Area
Purchase History
| Date | Buyer | Sale Price | Title Company |
|---|---|---|---|
| Imschweiler Frank M | $620,000 | -- | |
| Imschweiler Frank M | $620,000 | -- | |
| Lovotan Edwin A | $535,000 | -- | |
| Land America Onestop I | $533,000 | -- | |
| Land America Onestop I | $533,000 | -- | |
| Lampkin Stephen A | $432,000 | -- | |
| Lampkin Stephen A | $432,000 | -- | |
| Remeika Michael | $225,000 | -- | |
| Remeika Michael | $225,000 | -- |
Source: Public Records
Mortgage History
| Date | Status | Borrower | Loan Amount |
|---|---|---|---|
| Open | Remeika Michael | $600,000 | |
| Closed | Remeika Michael | $600,000 | |
| Previous Owner | Remeika Michael | $428,000 |
Source: Public Records
Tax History Compared to Growth
Tax History
| Year | Tax Paid | Tax Assessment Tax Assessment Total Assessment is a certain percentage of the fair market value that is determined by local assessors to be the total taxable value of land and additions on the property. | Land | Improvement |
|---|---|---|---|---|
| 2025 | $10,843 | $381,920 | $266,700 | $115,220 |
| 2024 | $10,656 | $381,920 | $266,700 | $115,220 |
| 2023 | $10,507 | $381,920 | $266,700 | $115,220 |
| 2022 | $10,404 | $381,920 | $266,700 | $115,220 |
| 2021 | $10,180 | $377,300 | $266,700 | $110,600 |
| 2020 | $9,476 | $353,710 | $228,970 | $124,740 |
| 2019 | $9,476 | $353,710 | $228,970 | $124,740 |
| 2018 | $9,324 | $353,710 | $228,970 | $124,740 |
| 2017 | $9,133 | $353,710 | $228,970 | $124,740 |
| 2016 | $9,002 | $353,710 | $228,970 | $124,740 |
| 2015 | $8,788 | $354,480 | $243,180 | $111,300 |
| 2014 | $8,649 | $354,480 | $243,180 | $111,300 |
Source: Public Records
Map
Nearby Homes
- 251 Winnepoge Dr
- 2492 Congress St
- 109 Buckboard Ln
- 357 Harvester Rd
- 264 Harvester Rd
- 947 Galloping Hill Rd
- 312 Towne House Rd
- 273 Wheeler Park Ave
- 71 Schiller Rd
- 342 Midlock Rd
- 2959 Congress St
- 750 Burr St
- 31 High Ridge Rd
- 893 Church Hill Rd
- 1748 Stratfield Rd
- 178 Autumn Ridge Rd
- 66 Wynn Wood Dr
- 99 Old Academy Rd
- 342 Fairfield Woods Rd
- 160 Fairfield Woods Rd Unit 35
- 403 Nonopoge Rd
- 367 Nonopoge Rd
- 3890 Black Rock Turnpike
- 415 Nonopoge Rd
- 372 Nonopoge Rd
- 341 Nonopoge Rd
- 3870 Black Rock Turnpike
- 398 Nonopoge Rd
- 350 Nonopoge Rd
- 324 Nonopoge Rd
- 176 Lakewood Dr
- 3840 Black Rock Turnpike
- 309 Nonopoge Rd
- 170 Lakewood Dr
- 462 Nonopoge Rd
- 306 Nonopoge Rd
- 495 Romanock Rd
- 1745 Congress St
- 485 Romanock Rd
- 1775 Congress St