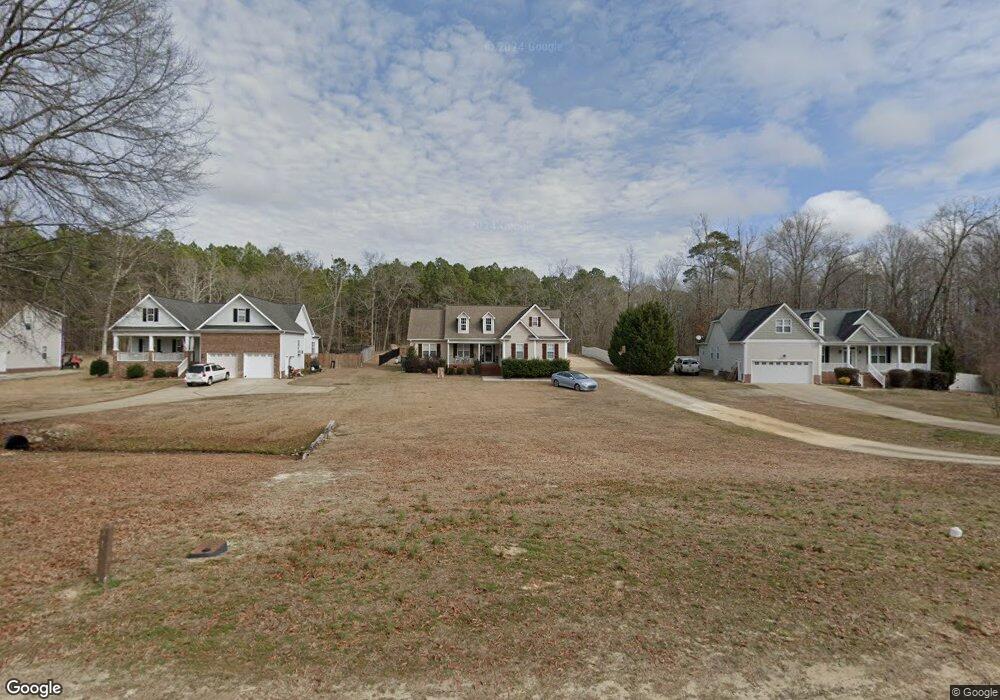
391 Rocky Run Ln Lillington, NC 27546
Estimated Value: $318,344 - $331,000
3
Beds
2
Baths
1,913
Sq Ft
$169/Sq Ft
Est. Value
About This Home
This home is located at 391 Rocky Run Ln, Lillington, NC 27546 and is currently estimated at $323,336, approximately $169 per square foot. 391 Rocky Run Ln is a home located in Harnett County with nearby schools including Buies Creek Elementary School, Harnett Central Middle School, and Harnett Central High School.
Ownership History
Date
Name
Owned For
Owner Type
Purchase Details
Closed on
Jun 12, 2018
Sold by
Schlieman Jacob Daniel
Bought by
Champion Bobby Joe and Champion Brandy Leigh
Current Estimated Value
Home Financials for this Owner
Home Financials are based on the most recent Mortgage that was taken out on this home.
Original Mortgage
$186,869
Outstanding Balance
$161,610
Interest Rate
4.5%
Mortgage Type
New Conventional
Estimated Equity
$161,726
Purchase Details
Closed on
May 27, 2010
Sold by
Herring Brian Earl and Herring Holly Kendall
Bought by
Schlieman Jacob Daniel
Home Financials for this Owner
Home Financials are based on the most recent Mortgage that was taken out on this home.
Original Mortgage
$156,593
Interest Rate
4.75%
Mortgage Type
FHA
Purchase Details
Closed on
Dec 5, 2006
Sold by
Adams Ii Conrad L and Adams Gail M
Bought by
Herring Brian Earl
Create a Home Valuation Report for This Property
The Home Valuation Report is an in-depth analysis detailing your home's value as well as a comparison with similar homes in the area
Home Values in the Area
Average Home Value in this Area
Purchase History
| Date | Buyer | Sale Price | Title Company |
|---|---|---|---|
| Champion Bobby Joe | $185,000 | None Available | |
| Schlieman Jacob Daniel | $171,000 | -- | |
| Herring Brian Earl | $42,000 | None Available |
Source: Public Records
Mortgage History
| Date | Status | Borrower | Loan Amount |
|---|---|---|---|
| Open | Champion Bobby Joe | $186,869 | |
| Previous Owner | Schlieman Jacob Daniel | $156,593 |
Source: Public Records
Tax History Compared to Growth
Tax History
| Year | Tax Paid | Tax Assessment Tax Assessment Total Assessment is a certain percentage of the fair market value that is determined by local assessors to be the total taxable value of land and additions on the property. | Land | Improvement |
|---|---|---|---|---|
| 2025 | $1,664 | $225,988 | $0 | $0 |
| 2024 | $1,647 | $225,988 | $0 | $0 |
| 2023 | $1,647 | $225,988 | $0 | $0 |
| 2022 | $1,482 | $225,988 | $0 | $0 |
| 2021 | $1,482 | $164,300 | $0 | $0 |
| 2020 | $1,482 | $164,300 | $0 | $0 |
| 2019 | $1,467 | $164,300 | $0 | $0 |
| 2018 | $1,467 | $164,300 | $0 | $0 |
| 2017 | $1,467 | $164,300 | $0 | $0 |
| 2016 | $1,548 | $173,870 | $0 | $0 |
| 2015 | $1,548 | $173,870 | $0 | $0 |
| 2014 | $1,548 | $173,870 | $0 | $0 |
Source: Public Records
Map
Nearby Homes
- 394 Rocky Run Ln
- 45 Braddock Dr
- 222 Anna St
- 19 Kimberly Ct
- 329 Anna St
- 4 Bill Avery Rd
- 2 Bill Avery Rd
- 122 Bill Avery Rd
- 125 Celtic Ln
- 305 River Birch Run
- 229 Great Smoky Place
- 262 River Birch Run
- 3415 Great Smoky Place
- 18 Frost Meadow Way
- 33 Celtic Ln
- 44 Frost Meadow Way
- 585 Bill Avery Rd
- 15 Celtic Ln
- 63 Whimbrel Ct
- 126 River Birch Run
- 381 Rocky Run Ln
- 395 Rocky Run Ln
- 361 Rocky Run Ln
- 341 Rocky Run Ln
- 368 Rocky Run Ln
- 400 Rocky Run Ln
- 364 Rocky Run Ln
- 0000 Rocky Run
- 334 Rocky Run Ln
- 344 Rocky Run Ln
- 324 Rocky Run Ln
- 291 Rocky Run Ln
- 304 Rocky Run Ln
- 307 Arbor Crest Ln
- 285 Arbor Crest Ln
- 265 Rocky Run Ln
- 261 Arbor Crest Ln
- 321 Arbor Crest Ln
- 15 Ray Con Cir
- 31 Ray Con Cir