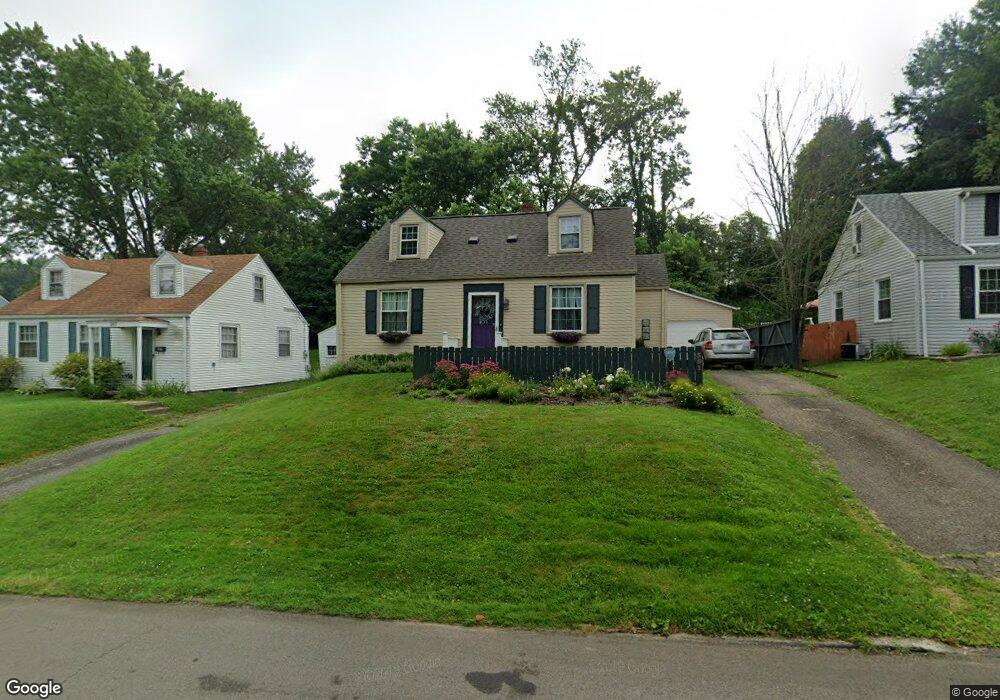
391 S Linden Rd Mansfield, OH 44906
Estimated Value: $117,000 - $129,821
3
Beds
1
Bath
1,102
Sq Ft
$111/Sq Ft
Est. Value
About This Home
This home is located at 391 S Linden Rd, Mansfield, OH 44906 and is currently estimated at $122,705, approximately $111 per square foot. 391 S Linden Rd is a home located in Richland County with nearby schools including Mansfield Elective Academy, Interactive Media & Construction (IMAC) Academy, and Discovery School.
Ownership History
Date
Name
Owned For
Owner Type
Purchase Details
Closed on
Jul 31, 2007
Sold by
Lehr David W and Lehr Jacqueline H
Bought by
Lehr Susan M
Current Estimated Value
Purchase Details
Closed on
Nov 30, 1998
Sold by
Zody Jeffrey D
Bought by
Lehr David W
Home Financials for this Owner
Home Financials are based on the most recent Mortgage that was taken out on this home.
Original Mortgage
$62,190
Interest Rate
8.5%
Purchase Details
Closed on
Nov 7, 1996
Sold by
Swiderski Michael J
Bought by
Zody Jeffrey D
Home Financials for this Owner
Home Financials are based on the most recent Mortgage that was taken out on this home.
Original Mortgage
$53,200
Interest Rate
8.26%
Purchase Details
Closed on
May 6, 1994
Sold by
Robertson Susan J
Bought by
Swiderski Michael J
Purchase Details
Closed on
Nov 9, 1990
Sold by
Crouse Ii Hugh W
Bought by
Robertson Susan J
Purchase Details
Closed on
Mar 1, 1985
Create a Home Valuation Report for This Property
The Home Valuation Report is an in-depth analysis detailing your home's value as well as a comparison with similar homes in the area
Home Values in the Area
Average Home Value in this Area
Purchase History
| Date | Buyer | Sale Price | Title Company |
|---|---|---|---|
| Lehr Susan M | -- | None Available | |
| Lehr David W | $69,100 | -- | |
| Zody Jeffrey D | $56,000 | -- | |
| Swiderski Michael J | $47,000 | -- | |
| Robertson Susan J | $33,000 | -- | |
| -- | $28,300 | -- |
Source: Public Records
Mortgage History
| Date | Status | Borrower | Loan Amount |
|---|---|---|---|
| Previous Owner | Lehr David W | $62,190 | |
| Previous Owner | Zody Jeffrey D | $53,200 |
Source: Public Records
Tax History Compared to Growth
Tax History
| Year | Tax Paid | Tax Assessment Tax Assessment Total Assessment is a certain percentage of the fair market value that is determined by local assessors to be the total taxable value of land and additions on the property. | Land | Improvement |
|---|---|---|---|---|
| 2024 | $1,308 | $27,900 | $3,770 | $24,130 |
| 2023 | $1,308 | $27,900 | $3,770 | $24,130 |
| 2022 | $1,197 | $21,380 | $3,230 | $18,150 |
| 2021 | $1,205 | $21,380 | $3,230 | $18,150 |
| 2020 | $1,232 | $21,380 | $3,230 | $18,150 |
| 2019 | $1,366 | $21,380 | $3,230 | $18,150 |
| 2018 | $1,347 | $21,380 | $3,230 | $18,150 |
| 2017 | $735 | $21,380 | $3,230 | $18,150 |
| 2016 | $1,218 | $19,270 | $4,480 | $14,790 |
| 2015 | $1,164 | $19,270 | $4,480 | $14,790 |
| 2014 | $1,149 | $19,270 | $4,480 | $14,790 |
| 2012 | $876 | $19,270 | $4,480 | $14,790 |
Source: Public Records
Map
Nearby Homes
- 408 Fairlawn Ave
- 212 Marlow Rd
- 244 S Trimble Rd Unit 246
- 232 S Trimble Rd Unit 234
- 679 Coleman Rd
- 216 S Trimble Rd Unit 218
- 191 Fairlawn Ave
- 1068 Linwood Place
- 616 Cline Ave
- 143 Fairlawn Ave
- 135 Fairlawn Ave
- 0 Bally Row Unit Lot 22930 223011207
- 0 Bally Row Unit Lot 22929 223011206
- 0 Bally Row Unit Lot 22940 223011208
- 129 Fairlawn Ave
- 0 Old Mill Run Rd Unit 9067543
- 0 Old Mill Run Rd Unit 9067542
- 0 S Trimble Rd
- 538 Broadview Ave
- 142 Grasmere Ave
- 387 S Linden Rd
- 397 S Linden Rd
- 381 S Linden Rd
- 399 S Linden Rd
- 390 S Linden Rd
- 377 S Linden Rd
- 396 S Linden Rd
- 405 S Linden Rd
- 386 S Linden Rd
- 398 S Linden Rd
- 380 S Linden Rd
- 371 S Linden Rd
- 411 S Linden Rd
- 376 S Linden Rd
- 871 Manchester Rd
- 408 S Linden Rd
- 865 Manchester Rd
- 370 S Linden Rd
- 367 S Linden Rd
- 417 S Linden Rd