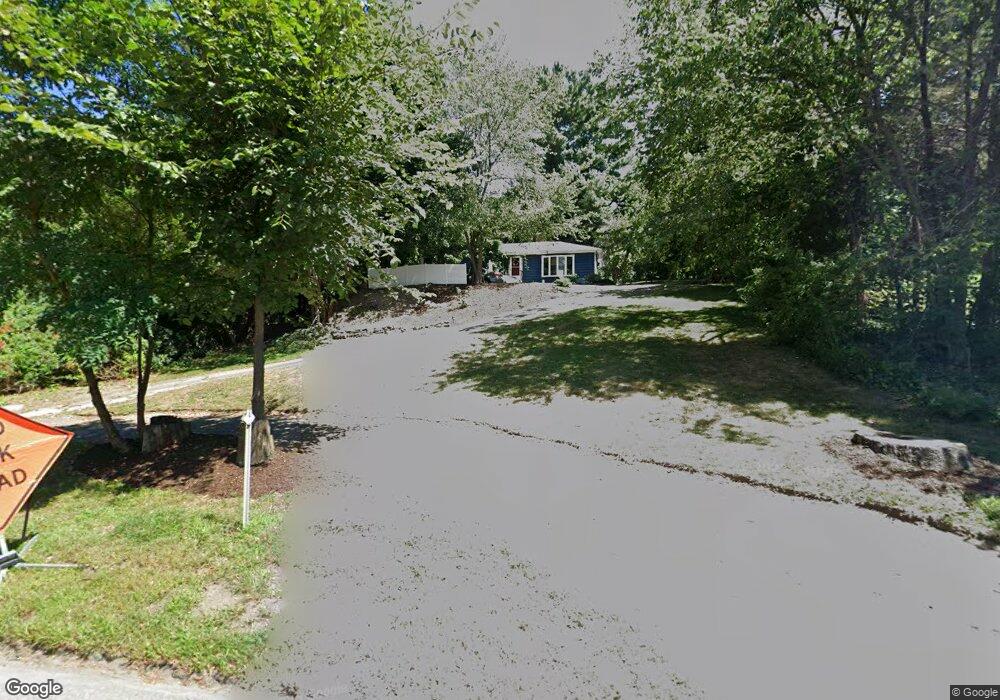
391 South St Plainville, MA 02762
Estimated Value: $463,000 - $620,000
2
Beds
2
Baths
1,000
Sq Ft
$508/Sq Ft
Est. Value
About This Home
This home is located at 391 South St, Plainville, MA 02762 and is currently estimated at $507,822, approximately $507 per square foot. 391 South St is a home located in Norfolk County with nearby schools including Anna Ware Jackson School, Beatrice H. Wood Elementary School, and Cadence Academy Preschool - North Attleborough.
Ownership History
Date
Name
Owned For
Owner Type
Purchase Details
Closed on
Jun 30, 1995
Sold by
Casper J Blaisdell Rt
Bought by
Ketz John
Current Estimated Value
Home Financials for this Owner
Home Financials are based on the most recent Mortgage that was taken out on this home.
Original Mortgage
$108,300
Interest Rate
7.8%
Mortgage Type
Purchase Money Mortgage
Create a Home Valuation Report for This Property
The Home Valuation Report is an in-depth analysis detailing your home's value as well as a comparison with similar homes in the area
Home Values in the Area
Average Home Value in this Area
Purchase History
| Date | Buyer | Sale Price | Title Company |
|---|---|---|---|
| Ketz John | $114,000 | -- | |
| Ketz John | $114,000 | -- |
Source: Public Records
Mortgage History
| Date | Status | Borrower | Loan Amount |
|---|---|---|---|
| Closed | Ketz John | $108,300 |
Source: Public Records
Tax History Compared to Growth
Tax History
| Year | Tax Paid | Tax Assessment Tax Assessment Total Assessment is a certain percentage of the fair market value that is determined by local assessors to be the total taxable value of land and additions on the property. | Land | Improvement |
|---|---|---|---|---|
| 2025 | $43 | $375,500 | $213,100 | $162,400 |
| 2024 | $4,199 | $349,900 | $193,100 | $156,800 |
| 2023 | $4,148 | $332,400 | $193,100 | $139,300 |
| 2022 | $3,997 | $284,900 | $184,700 | $100,200 |
| 2021 | $3,831 | $260,600 | $184,700 | $75,900 |
| 2020 | $3,729 | $253,700 | $184,700 | $69,000 |
| 2019 | $3,783 | $252,700 | $184,700 | $68,000 |
| 2018 | $3,544 | $235,300 | $167,300 | $68,000 |
| 2017 | $3,530 | $235,300 | $167,300 | $68,000 |
| 2016 | $3,521 | $237,400 | $167,300 | $70,100 |
| 2015 | $3,284 | $213,000 | $143,200 | $69,800 |
| 2014 | $3,201 | $214,000 | $143,200 | $70,800 |
Source: Public Records
Map
Nearby Homes
- 387 South St
- 12 Grant St
- 4 Munroe Dr
- 80 Willow Ln
- 29 Broad St
- 1222 South St
- 19 Chestnut Lot 0
- 19 Valerie Dr
- 5 Farm Hill Ln
- 11 Amber Dr
- 158 Washington St
- 126 Washington St
- 130 Washington St
- 124 Washington St
- 50 Green St
- 45 Moran St
- 9 Sunnyside Dr Unit 9
- 35-R Whiting St
- 102 High St
- 791 South St Unit 5