Estimated Value: $314,000 - $353,678
3
Beds
2
Baths
1,674
Sq Ft
$202/Sq Ft
Est. Value
About This Home
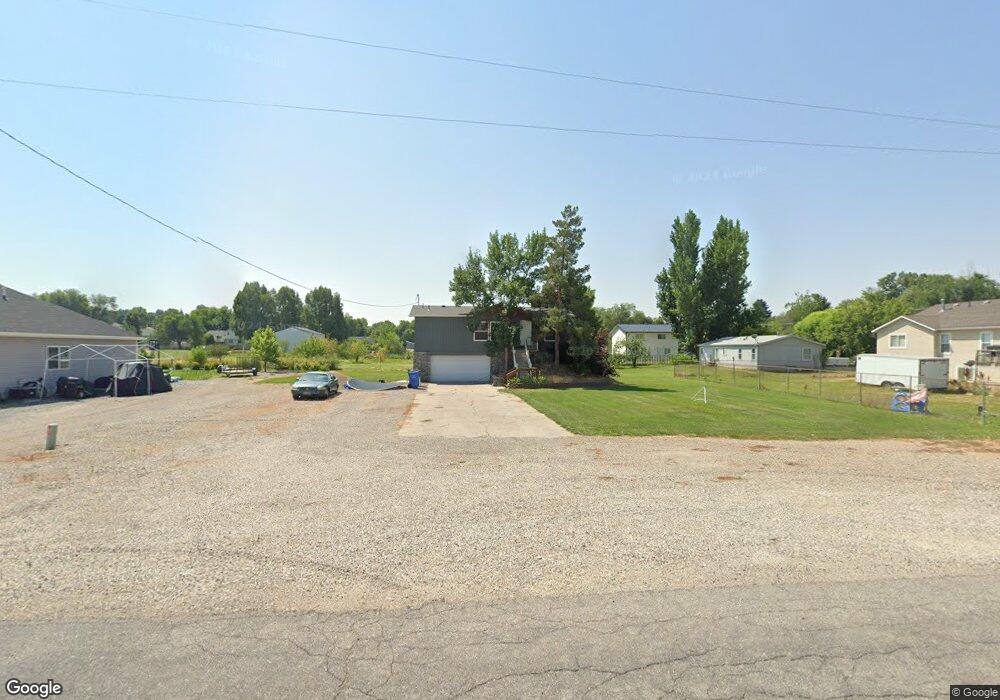
This home is located at 391 W 100 S, Hyrum, UT 84319 and is currently estimated at $337,920, approximately $201 per square foot. 391 W 100 S is a home located in Cache County with nearby schools including Lincoln School, South Cache Middle School, and Mountain Crest High School.
Ownership History
Date
Name
Owned For
Owner Type
Purchase Details
Closed on
Sep 26, 2014
Sold by
Secretary Of Housing & Urban Development
Bought by
Rollins Joey D
Current Estimated Value
Home Financials for this Owner
Home Financials are based on the most recent Mortgage that was taken out on this home.
Original Mortgage
$52,000
Outstanding Balance
$39,591
Interest Rate
4.07%
Mortgage Type
New Conventional
Estimated Equity
$298,330
Purchase Details
Closed on
Apr 8, 2013
Sold by
Bank Of America Na
Bought by
Secretary Of Housing & Urban Development
Purchase Details
Closed on
Nov 20, 2012
Sold by
The Secretary Of Housing & Urban Develop
Bought by
Bank Of America Na
Purchase Details
Closed on
Dec 23, 2009
Sold by
Bac Home Loans Servicing Lp
Bought by
Secretary Of Housing & Urban Development
Create a Home Valuation Report for This Property
The Home Valuation Report is an in-depth analysis detailing your home's value as well as a comparison with similar homes in the area
Home Values in the Area
Average Home Value in this Area
Purchase History
| Date | Buyer | Sale Price | Title Company |
|---|---|---|---|
| Rollins Joey D | -- | Pinnacle Title | |
| Secretary Of Housing & Urban Development | -- | None Available | |
| Bank Of America Na | -- | None Available | |
| Secretary Of Housing & Urban Development | -- | Backman Fptp | |
| Bac Home Loans Servicing Lp | $96,805 | Backman Title Services |
Source: Public Records
Mortgage History
| Date | Status | Borrower | Loan Amount |
|---|---|---|---|
| Open | Rollins Joey D | $52,000 |
Source: Public Records
Tax History Compared to Growth
Tax History
| Year | Tax Paid | Tax Assessment Tax Assessment Total Assessment is a certain percentage of the fair market value that is determined by local assessors to be the total taxable value of land and additions on the property. | Land | Improvement |
|---|---|---|---|---|
| 2025 | $1,027 | $147,500 | $0 | $0 |
| 2024 | $1,126 | $150,950 | $0 | $0 |
| 2023 | $1,207 | $154,725 | $0 | $0 |
| 2022 | $1,259 | $154,720 | $0 | $0 |
| 2021 | $1,259 | $238,295 | $66,200 | $172,095 |
| 2020 | $974 | $173,092 | $66,200 | $106,892 |
| 2019 | $901 | $150,592 | $43,700 | $106,892 |
| 2018 | $846 | $136,650 | $43,700 | $92,950 |
| 2017 | $841 | $70,510 | $0 | $0 |
| 2016 | $860 | $70,510 | $0 | $0 |
| 2015 | $844 | $69,005 | $0 | $0 |
| 2014 | $825 | $69,005 | $0 | $0 |
| 2013 | -- | $69,005 | $0 | $0 |
Source: Public Records
Map
Nearby Homes