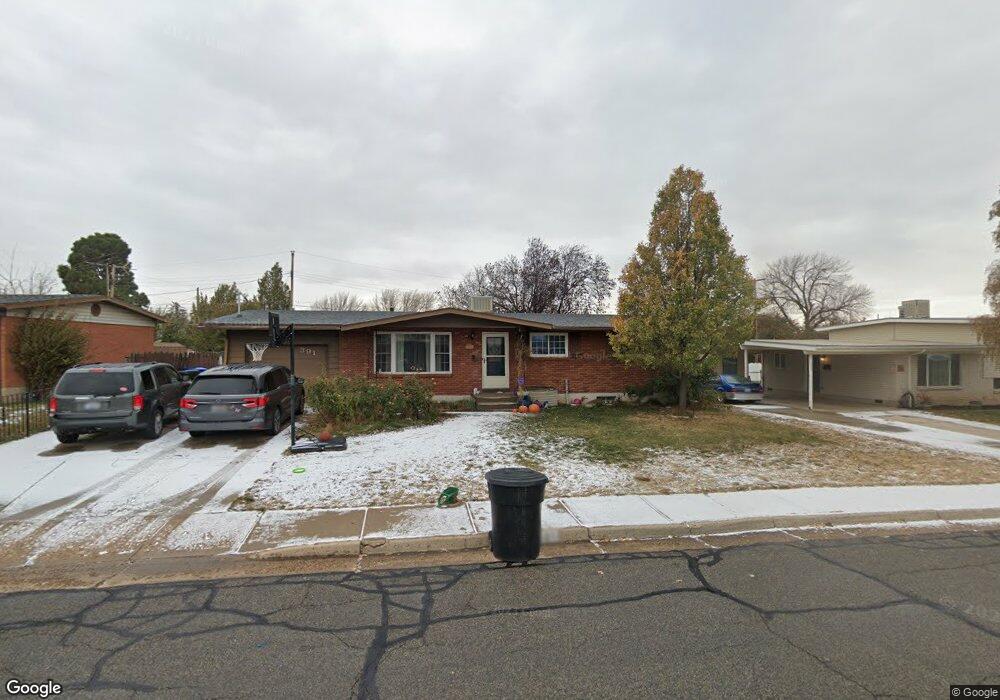
391 W 2200 N Clearfield, UT 84015
Estimated Value: $395,000 - $420,000
4
Beds
3
Baths
2,420
Sq Ft
$169/Sq Ft
Est. Value
About This Home
This home is located at 391 W 2200 N, Clearfield, UT 84015 and is currently estimated at $408,188, approximately $168 per square foot. 391 W 2200 N is a home located in Davis County with nearby schools including Sunset School, Sunset Junior High School, and Northridge High School.
Ownership History
Date
Name
Owned For
Owner Type
Purchase Details
Closed on
Feb 25, 2009
Sold by
Gordon Jeremy B
Bought by
Gordon Jeremy B and Gordon Geri E
Current Estimated Value
Home Financials for this Owner
Home Financials are based on the most recent Mortgage that was taken out on this home.
Original Mortgage
$165,654
Outstanding Balance
$103,644
Interest Rate
4.91%
Mortgage Type
FHA
Estimated Equity
$304,544
Purchase Details
Closed on
Aug 25, 2008
Sold by
Gordon Jeremy B
Bought by
Gordon Jeremy B and Gordon Geri E
Purchase Details
Closed on
Jul 7, 2005
Sold by
Henson Fred
Bought by
Gordon Jeremy B
Create a Home Valuation Report for This Property
The Home Valuation Report is an in-depth analysis detailing your home's value as well as a comparison with similar homes in the area
Home Values in the Area
Average Home Value in this Area
Purchase History
| Date | Buyer | Sale Price | Title Company |
|---|---|---|---|
| Gordon Jeremy B | -- | Executive Title Ins Agency | |
| Gordon Jeremy B | -- | Executive Title Ins Agency | |
| Gordon Jeremy B | -- | Executive Title Ins Agency | |
| Gordon Jeremy B | -- | Security Title | |
| Henson Fred | -- | Security Title | |
| Henson Fred | -- | Security Title |
Source: Public Records
Mortgage History
| Date | Status | Borrower | Loan Amount |
|---|---|---|---|
| Open | Gordon Jeremy B | $165,654 |
Source: Public Records
Tax History Compared to Growth
Tax History
| Year | Tax Paid | Tax Assessment Tax Assessment Total Assessment is a certain percentage of the fair market value that is determined by local assessors to be the total taxable value of land and additions on the property. | Land | Improvement |
|---|---|---|---|---|
| 2025 | $2,352 | $214,500 | $75,188 | $139,312 |
| 2024 | $2,212 | $201,850 | $71,862 | $129,988 |
| 2023 | $2,086 | $347,000 | $114,709 | $232,291 |
| 2022 | $2,230 | $200,750 | $65,519 | $135,231 |
| 2021 | $1,929 | $273,000 | $71,012 | $201,988 |
| 2020 | $1,689 | $235,000 | $59,995 | $175,005 |
| 2019 | $1,591 | $227,000 | $75,518 | $151,482 |
| 2018 | $1,417 | $198,000 | $60,350 | $137,650 |
| 2016 | $1,203 | $86,350 | $28,539 | $57,811 |
| 2015 | $1,181 | $80,300 | $28,539 | $51,761 |
| 2014 | $1,085 | $75,397 | $28,539 | $46,858 |
| 2013 | -- | $63,164 | $23,265 | $39,899 |
Source: Public Records
Map
Nearby Homes
- 2177 N 450 W
- 648 W 2200 N
- 2512 N 475 W
- 2085 N Main St Unit 409
- 2085 N Main St Unit 108
- 2085 N Main St Unit 401
- 2085 N Main St Unit 308
- 2085 N Main St Unit 116
- 2085 N Main St Unit 201
- 2085 N Main St Unit 402
- 2085 N Main St Unit 202
- 2085 N Main St Unit 301
- 2085 N Main St Unit 302
- 2085 N Main St Unit 115
- 1874 N 200 W
- 2101 N Main St Unit 205
- 2101 N Main St Unit 409
- 389 W 2575 N
- 52 W 2000 N
- 1974 N 75 W