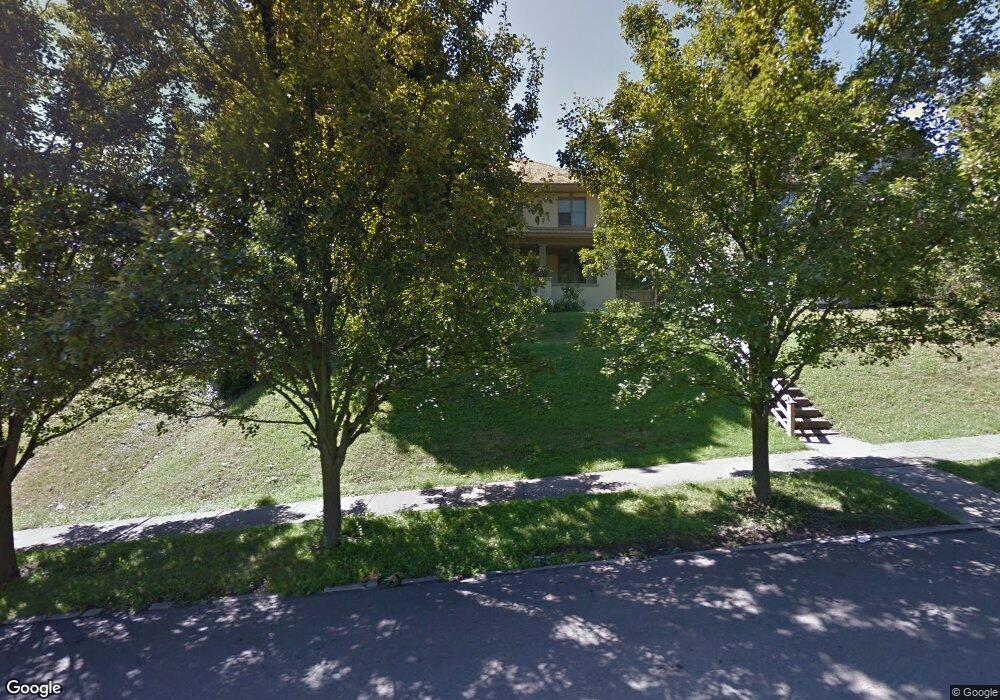
391 W 3rd St Mansfield, OH 44903
Estimated Value: $57,000 - $144,417
4
Beds
2
Baths
2,838
Sq Ft
$36/Sq Ft
Est. Value
About This Home
This home is located at 391 W 3rd St, Mansfield, OH 44903 and is currently estimated at $101,854, approximately $35 per square foot. 391 W 3rd St is a home located in Richland County with nearby schools including Goal Digital Academy, St. Peter's Elementary/Montessori School, and St. Peter's Junior High / High School.
Ownership History
Date
Name
Owned For
Owner Type
Purchase Details
Closed on
Mar 26, 2007
Sold by
Blaney Dorothy E and Blaney Tom W
Bought by
Woodcock Barbara
Current Estimated Value
Purchase Details
Closed on
Jul 29, 2004
Sold by
Fannie Mae
Bought by
Blaney Dorothy E and Blaney Tom W
Purchase Details
Closed on
Jan 23, 2004
Sold by
Knipp Stephanie L and Knipp Paul Jason
Bought by
Federal National Mortgage Association
Create a Home Valuation Report for This Property
The Home Valuation Report is an in-depth analysis detailing your home's value as well as a comparison with similar homes in the area
Home Values in the Area
Average Home Value in this Area
Purchase History
| Date | Buyer | Sale Price | Title Company |
|---|---|---|---|
| Woodcock Barbara | $107,000 | Southern Title | |
| Blaney Dorothy E | $30,000 | Title First Agency Inc | |
| Federal National Mortgage Association | $30,000 | -- |
Source: Public Records
Tax History
| Year | Tax Paid | Tax Assessment Tax Assessment Total Assessment is a certain percentage of the fair market value that is determined by local assessors to be the total taxable value of land and additions on the property. | Land | Improvement |
|---|---|---|---|---|
| 2024 | $1,056 | $23,120 | $2,720 | $20,400 |
| 2023 | $1,084 | $23,120 | $2,720 | $20,400 |
| 2022 | $1,054 | $18,850 | $2,640 | $16,210 |
| 2021 | $1,062 | $18,850 | $2,640 | $16,210 |
| 2020 | $1,086 | $18,850 | $2,640 | $16,210 |
| 2019 | $1,203 | $18,850 | $2,640 | $16,210 |
| 2018 | $1,187 | $18,850 | $2,640 | $16,210 |
| 2017 | $1,210 | $18,850 | $2,640 | $16,210 |
| 2016 | $1,265 | $20,030 | $4,620 | $15,410 |
| 2015 | $1,209 | $20,030 | $4,620 | $15,410 |
| 2014 | $1,193 | $20,030 | $4,620 | $15,410 |
| 2012 | $479 | $21,090 | $4,870 | $16,220 |
Source: Public Records
Map
Nearby Homes
- 81 Penn Ave
- 30 Douglas Ave
- 31 Bartley Ave
- 119 Carpenter Rd
- 212 Penn Ave
- 158 Vennum Ave
- 368 W 6th St
- 24 Stewart Ave S
- 362-364 W 6th St
- 135 Wood St
- 108 Stewart Ave S
- 133 Stewart Ave S
- 131 Sturges Ave
- 230 Rae Ave
- 116 Stewart Ave S
- 189 Westwood Ave
- 487 Davey Ave
- 282 Vennum Ave
- 455 Marion Ave
- 0 Voegele Ave Unit Lot 6048, 6049, 6
Your Personal Tour Guide
Ask me questions while you tour the home.