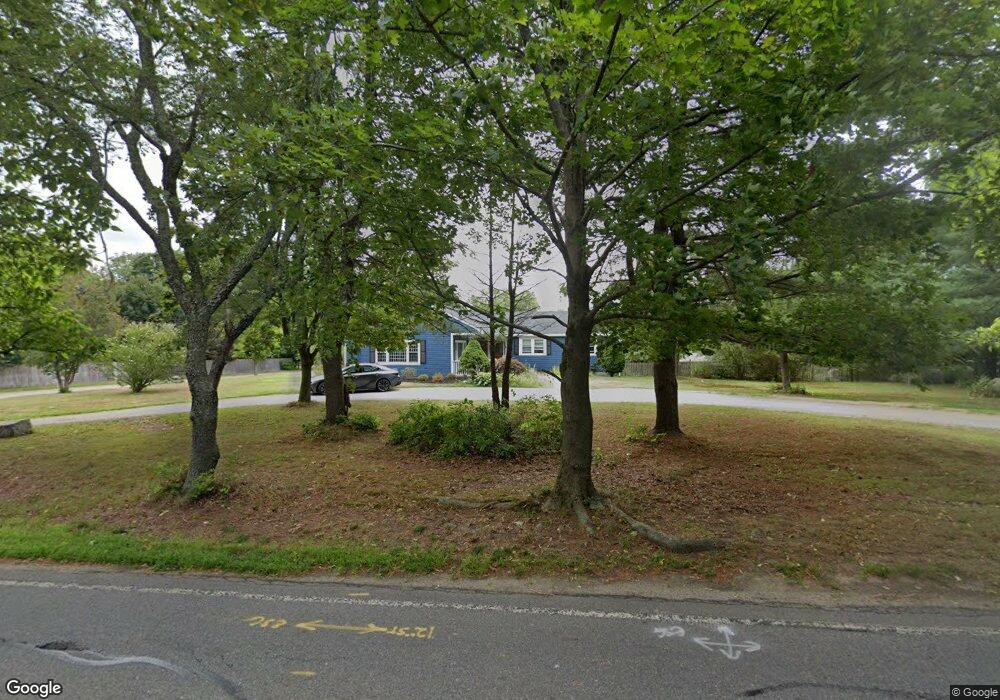
391 W Elm St Pembroke, MA 02359
Estimated Value: $662,000 - $940,000
3
Beds
3
Baths
2,556
Sq Ft
$298/Sq Ft
Est. Value
About This Home
This home is located at 391 W Elm St, Pembroke, MA 02359 and is currently estimated at $761,627, approximately $297 per square foot. 391 W Elm St is a home located in Plymouth County with nearby schools including Pembroke High School, Cadence Academy Preschool - Hanover, and Cardinal Cushing Centers.
Ownership History
Date
Name
Owned For
Owner Type
Purchase Details
Closed on
Aug 5, 2003
Sold by
Bird James A
Bought by
Bird James A and Bird Kim
Current Estimated Value
Home Financials for this Owner
Home Financials are based on the most recent Mortgage that was taken out on this home.
Original Mortgage
$265,000
Interest Rate
5.28%
Mortgage Type
Purchase Money Mortgage
Purchase Details
Closed on
Jul 31, 1996
Sold by
Aransky Lisa Bm and Ingalls Karen F
Bought by
Bird James A
Purchase Details
Closed on
May 28, 1993
Sold by
Mindick Joseph
Bought by
Ingalls Karen F and Ingalls Christopher W
Create a Home Valuation Report for This Property
The Home Valuation Report is an in-depth analysis detailing your home's value as well as a comparison with similar homes in the area
Home Values in the Area
Average Home Value in this Area
Purchase History
| Date | Buyer | Sale Price | Title Company |
|---|---|---|---|
| Bird James A | -- | -- | |
| Bird James A | $182,500 | -- | |
| Ingalls Karen F | $163,500 | -- |
Source: Public Records
Mortgage History
| Date | Status | Borrower | Loan Amount |
|---|---|---|---|
| Open | Ingalls Karen F | $381,545 | |
| Closed | Ingalls Karen F | $265,000 |
Source: Public Records
Tax History Compared to Growth
Tax History
| Year | Tax Paid | Tax Assessment Tax Assessment Total Assessment is a certain percentage of the fair market value that is determined by local assessors to be the total taxable value of land and additions on the property. | Land | Improvement |
|---|---|---|---|---|
| 2025 | $7,050 | $586,500 | $295,000 | $291,500 |
| 2024 | $6,880 | $571,900 | $283,200 | $288,700 |
| 2023 | $6,833 | $537,200 | $269,300 | $267,900 |
| 2022 | $6,421 | $453,800 | $222,100 | $231,700 |
| 2021 | $5,918 | $405,900 | $207,700 | $198,200 |
| 2020 | $5,835 | $402,700 | $203,200 | $199,500 |
| 2019 | $5,579 | $382,100 | $198,300 | $183,800 |
| 2018 | $5,381 | $361,400 | $195,900 | $165,500 |
| 2017 | $5,338 | $353,500 | $186,600 | $166,900 |
| 2016 | $5,205 | $341,100 | $172,800 | $168,300 |
| 2015 | $4,916 | $333,500 | $163,500 | $170,000 |
Source: Public Records
Map
Nearby Homes
- 180 Elm St
- 7 Farmside Dr
- 186 Elm St
- 285 W Elm St
- 114 Graham Hill Dr
- 136 W Elm St
- 172 Washington St
- 55 Shipyard Ln
- 15 Elm Place
- 261 Washington St
- Lot 22 Adams Cir
- 20 Meadow Brook Rd
- 1251 Broadway
- 51 Cervelli Farm Dr
- 37 Dr
- 23 Cervelli Farm Dr
- 38 Cervelli Farm Dr
- 9 Cervelli Farm Dr
- 250 Center St
- 436 Center St
- 7 Captain Torrey Ln
- 389 W Elm St
- 403 W Elm St
- 15 Captain Torrey Ln
- 8 Captain Torrey Ln
- 39 Old West Elm St
- 407 W Elm St
- 14 Captain Torrey Ln
- 25 Captain Torrey Ln
- 15 Old West Elm St
- 27 Old West Elm St
- 379 W Elm St
- 415A W Elm St Unit A
- 415 W Elm St Unit B
- 415 W Elm St Unit A
- 415 W Elm St
- 413 W Elm St
- 20 Captain Torrey Ln
- 7 Old West Elm St
- 30 Old West Elm St