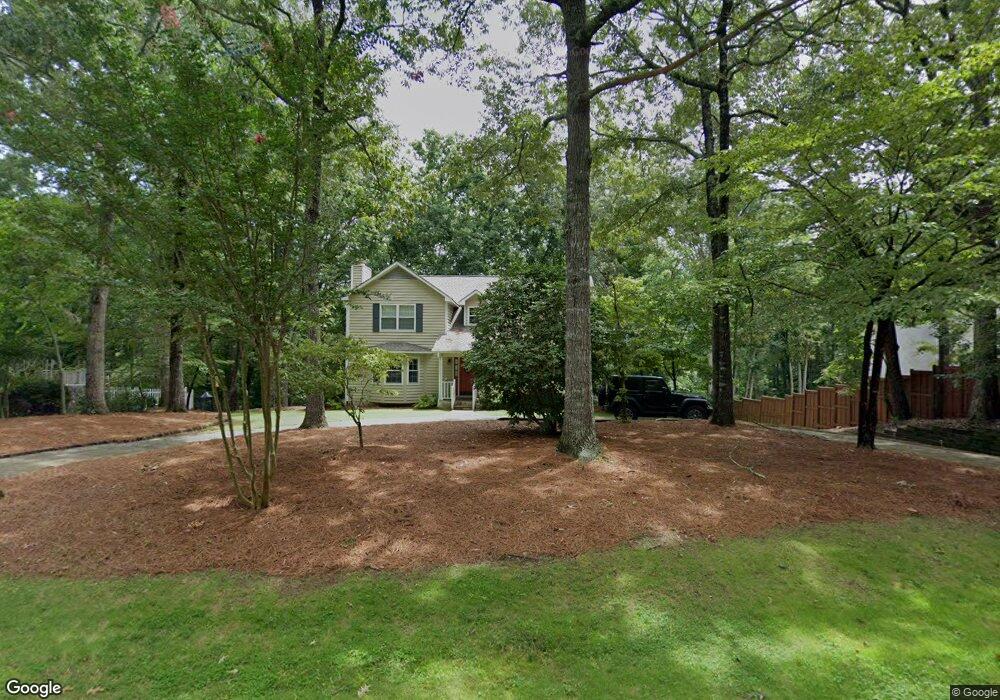
391 Westwoods Dr Ellijay, GA 30540
Estimated Value: $419,987 - $530,000
4
Beds
3
Baths
2,362
Sq Ft
$210/Sq Ft
Est. Value
About This Home
This home is located at 391 Westwoods Dr, Ellijay, GA 30540 and is currently estimated at $494,997, approximately $209 per square foot. 391 Westwoods Dr is a home located in Gilmer County with nearby schools including Ellijay Elementary School, Clear Creek Elementary School, and Clear Creek Middle School.
Ownership History
Date
Name
Owned For
Owner Type
Purchase Details
Closed on
Jul 25, 2023
Sold by
Lock Janine H
Bought by
Hicks Janine H and Hicks Plenneth P
Current Estimated Value
Purchase Details
Closed on
Apr 15, 2021
Sold by
Pettit Stacy
Bought by
Lock Janine H
Purchase Details
Closed on
Oct 15, 2020
Sold by
Millard Donna K
Bought by
Pettit Stacy and Pettit Rhonda
Purchase Details
Closed on
Aug 27, 2009
Sold by
Millard Michael
Bought by
Millard Michael
Purchase Details
Closed on
Mar 11, 2009
Sold by
Millard Michael and Millard Do
Bought by
Millard Michael
Purchase Details
Closed on
Jul 8, 1999
Sold by
Sparks Danny and Sparks Teres
Bought by
Millard Michael and Millard Do
Purchase Details
Closed on
Mar 10, 1999
Sold by
Ballengee Robert S
Bought by
Sparks Danny and Sparks Teres
Purchase Details
Closed on
Jul 1, 1993
Sold by
Ballengee Robert S
Bought by
Ballengee Robert S
Purchase Details
Closed on
Jun 1, 1987
Sold by
Ballengee Robert S
Bought by
Ballengee Robert S
Purchase Details
Closed on
Jan 1, 1986
Bought by
Ballengee Robert S
Create a Home Valuation Report for This Property
The Home Valuation Report is an in-depth analysis detailing your home's value as well as a comparison with similar homes in the area
Home Values in the Area
Average Home Value in this Area
Purchase History
| Date | Buyer | Sale Price | Title Company |
|---|---|---|---|
| Hicks Janine H | -- | -- | |
| Lock Janine H | $329,000 | -- | |
| Pettit Stacy | -- | -- | |
| Millard Michael | $249,900 | -- | |
| Millard Michael | $295,000 | -- | |
| Millard Michael | $164,500 | -- | |
| Sparks Danny | $140,000 | -- | |
| Ballengee Robert S | $126,000 | -- | |
| Ballengee Robert S | -- | -- | |
| Ballengee Robert S | -- | -- |
Source: Public Records
Tax History Compared to Growth
Tax History
| Year | Tax Paid | Tax Assessment Tax Assessment Total Assessment is a certain percentage of the fair market value that is determined by local assessors to be the total taxable value of land and additions on the property. | Land | Improvement |
|---|---|---|---|---|
| 2025 | $2,833 | $162,640 | $16,000 | $146,640 |
| 2024 | $2,833 | $164,640 | $10,000 | $154,640 |
| 2023 | $2,993 | $164,640 | $10,000 | $154,640 |
| 2022 | $2,536 | $144,120 | $10,000 | $134,120 |
| 2021 | $2,220 | $111,840 | $10,000 | $101,840 |
| 2020 | $2,193 | $99,720 | $10,000 | $89,720 |
| 2019 | $2,258 | $99,720 | $10,000 | $89,720 |
| 2018 | $2,012 | $87,720 | $6,000 | $81,720 |
| 2017 | $1,681 | $68,320 | $6,000 | $62,320 |
| 2016 | $1,735 | $69,120 | $6,000 | $63,120 |
| 2015 | $1,708 | $69,280 | $6,000 | $63,280 |
| 2014 | $1,668 | $65,080 | $6,000 | $59,080 |
| 2013 | -- | $68,160 | $6,000 | $62,160 |
Source: Public Records
Map
Nearby Homes
- 300 Westwoods Dr Unit 36
- 300 Westwoods Dr
- 276 Westwoods Dr Unit 37
- 276 Westwoods Dr
- 00 Timberland Dr
- 141 Gartrell St
- 36 Timberland Dr
- 165 Corbin Hill Rd
- Lot 114 Oak Valley Ct
- 6 Logan Way
- 66 Logan Ln
- Ga-382
- 114 Vista Heights Dr
- 14551 Highway 52
- LT 43&44 Reece Mountain Rd
- LT953 Ezra Ct
- 00 Highgrove Dr
- N/A Willard Mountain Rd
- 163 Jasmine Ct
- 84 Logan St
- 391 Westwoods Dr
- 423 Westwoods Dr
- 423 Westwoods Dr Unit 19
- 377 Westwoods Dr
- 364 Westwoods Dr
- 433 Westwoods Dr
- 400 Westwoods Dr
- 440 Westwoods Dr
- 345 Westwoods Dr
- 338 Westwoods Dr
- 338 Westwoods Dr Unit 35
- 465 Westwoods Dr
- 303 Westwoods Dr
- 71 Forest Glen Dr Unit 43
- 71 Forest Glen Dr
- 491 Westwoods Dr
- 488 Westwoods Dr
- 291 Westwoods Dr
- 134 Forest Glen Dr
- 59 Forest Glen Dr