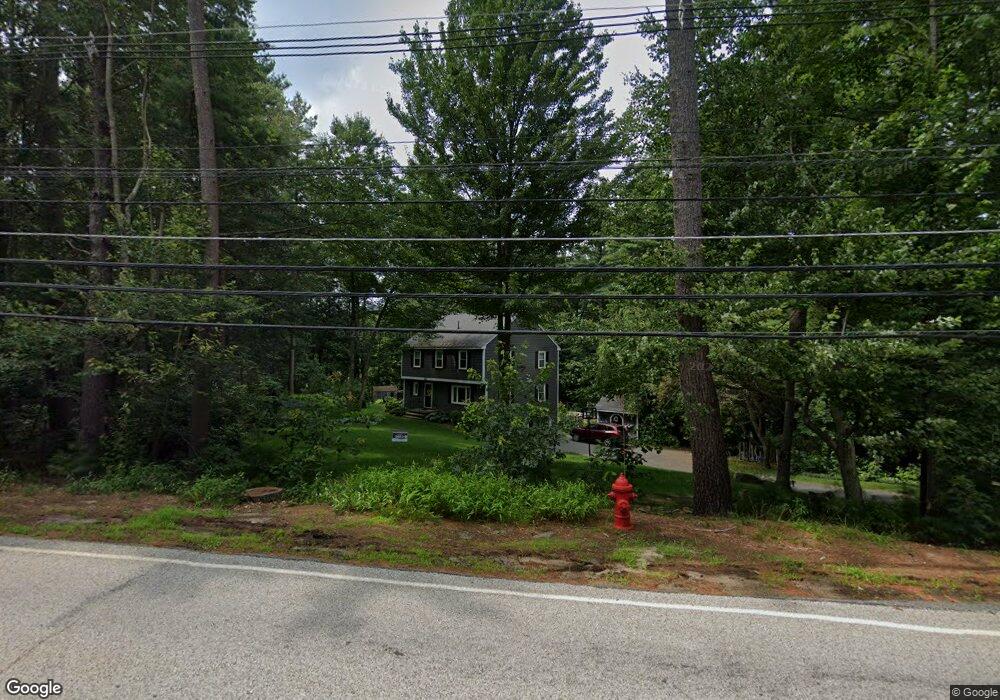
391 Whitney St Northborough, MA 01532
Estimated Value: $603,000 - $728,471
4
Beds
3
Baths
1,700
Sq Ft
$392/Sq Ft
Est. Value
About This Home
This home is located at 391 Whitney St, Northborough, MA 01532 and is currently estimated at $666,368, approximately $391 per square foot. 391 Whitney St is a home located in Worcester County with nearby schools including Marion E. Zeh Elementary School, Robert E. Melican Middle School, and Algonquin Regional High School.
Ownership History
Date
Name
Owned For
Owner Type
Purchase Details
Closed on
Oct 25, 2007
Sold by
Scarsdale Lloyd C and Scarsdale Martha E
Bought by
Gorham Joanne B and Gorham Jonathan D
Current Estimated Value
Home Financials for this Owner
Home Financials are based on the most recent Mortgage that was taken out on this home.
Original Mortgage
$328,000
Outstanding Balance
$207,636
Interest Rate
6.39%
Mortgage Type
Purchase Money Mortgage
Estimated Equity
$458,732
Purchase Details
Closed on
May 25, 2007
Sold by
Scarsdale Lloyd C
Bought by
Scarsdale Lloyd C and Scarsdale Martha E
Create a Home Valuation Report for This Property
The Home Valuation Report is an in-depth analysis detailing your home's value as well as a comparison with similar homes in the area
Home Values in the Area
Average Home Value in this Area
Purchase History
| Date | Buyer | Sale Price | Title Company |
|---|---|---|---|
| Gorham Joanne B | $364,500 | -- | |
| Scarsdale Lloyd C | -- | -- |
Source: Public Records
Mortgage History
| Date | Status | Borrower | Loan Amount |
|---|---|---|---|
| Open | Gorham Joanne B | $328,000 |
Source: Public Records
Tax History Compared to Growth
Tax History
| Year | Tax Paid | Tax Assessment Tax Assessment Total Assessment is a certain percentage of the fair market value that is determined by local assessors to be the total taxable value of land and additions on the property. | Land | Improvement |
|---|---|---|---|---|
| 2025 | $8,848 | $620,900 | $252,200 | $368,700 |
| 2024 | $7,356 | $515,100 | $204,100 | $311,000 |
| 2023 | $7,000 | $473,300 | $192,500 | $280,800 |
| 2022 | $6,728 | $408,000 | $183,300 | $224,700 |
| 2021 | $6,468 | $377,800 | $166,500 | $211,300 |
| 2020 | $6,612 | $383,300 | $166,500 | $216,800 |
| 2019 | $6,747 | $393,400 | $188,500 | $204,900 |
| 2018 | $6,506 | $374,100 | $183,700 | $190,400 |
| 2017 | $6,375 | $366,600 | $183,700 | $182,900 |
| 2016 | $6,233 | $363,000 | $180,100 | $182,900 |
| 2015 | $5,879 | $351,400 | $191,100 | $160,300 |
| 2014 | $5,576 | $336,100 | $191,100 | $145,000 |
Source: Public Records
Map
Nearby Homes
- 387 Whitney St
- 387 Whitney St Unit 1
- 395 Whitney St
- 30 Stone Dr
- 5 Coolidge Cir
- 420 Whitney St
- 424 Whitney St
- 424 Whitney St Unit 424
- 404 Whitney St
- 26 Stone Dr
- 22 Stone Dr
- 399 Whitney St
- 2 Coolidge Cir
- 416 Whitney St
- 408 Whitney St
- 6 Coolidge Cir
- 428 Whitney St
- 379 Whitney St
- 412 Whitney St
- 21 Stone Dr