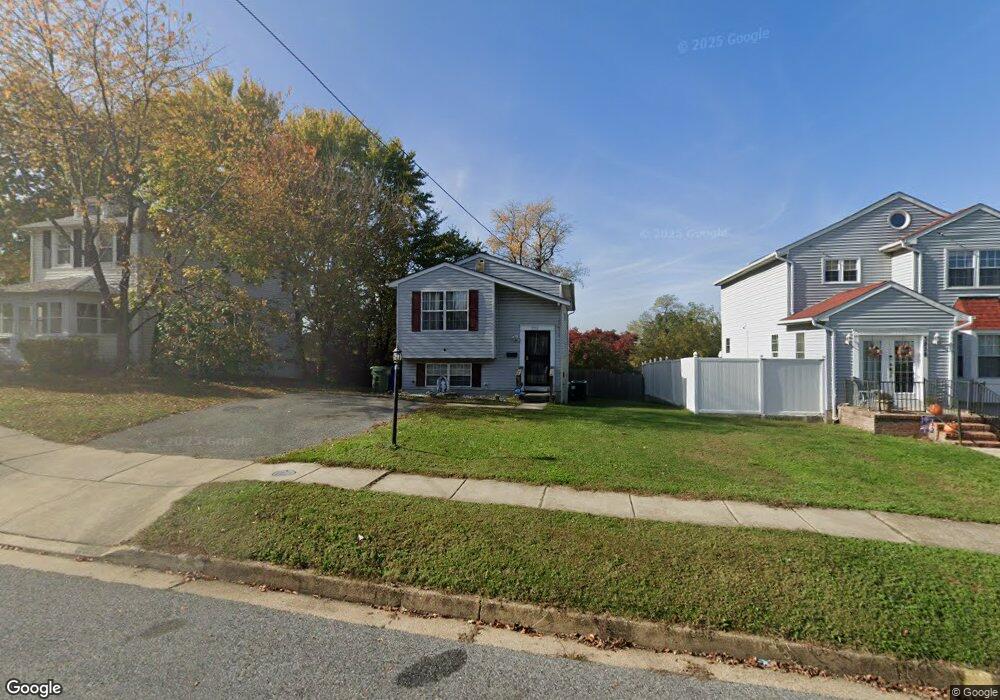
3910 3rd St Brooklyn, MD 21225
Estimated Value: $306,417 - $316,000
Studio
2
Baths
824
Sq Ft
$378/Sq Ft
Est. Value
About This Home
This home is located at 3910 3rd St, Brooklyn, MD 21225 and is currently estimated at $311,209, approximately $377 per square foot. 3910 3rd St is a home located in Baltimore City with nearby schools including Maree Garnett Farring Elementary School, Booker T. Washington Middle School, and Benjamin Franklin High School.
Ownership History
Date
Name
Owned For
Owner Type
Purchase Details
Closed on
Sep 8, 2008
Sold by
Harris Clifton
Bought by
Harris Linda
Current Estimated Value
Home Financials for this Owner
Home Financials are based on the most recent Mortgage that was taken out on this home.
Original Mortgage
$131,805
Outstanding Balance
$88,379
Interest Rate
6.69%
Mortgage Type
New Conventional
Estimated Equity
$222,830
Purchase Details
Closed on
Sep 10, 2002
Sold by
B P Taylor Construction 1Nc
Bought by
Harris Clifton and Harris Linda
Purchase Details
Closed on
Feb 19, 2002
Sold by
Cole Alice G
Bought by
B P Taylor Constructuion Inc
Create a Home Valuation Report for This Property
The Home Valuation Report is an in-depth analysis detailing your home's value as well as a comparison with similar homes in the area
Home Values in the Area
Average Home Value in this Area
Purchase History
| Date | Buyer | Sale Price | Title Company |
|---|---|---|---|
| Harris Linda | -- | -- | |
| Harris Clifton | $125,900 | -- | |
| B P Taylor Constructuion Inc | $22,000 | -- |
Source: Public Records
Mortgage History
| Date | Status | Borrower | Loan Amount |
|---|---|---|---|
| Open | Harris Linda | $131,805 |
Source: Public Records
Tax History
| Year | Tax Paid | Tax Assessment Tax Assessment Total Assessment is a certain percentage of the fair market value that is determined by local assessors to be the total taxable value of land and additions on the property. | Land | Improvement |
|---|---|---|---|---|
| 2025 | $4,116 | $220,000 | -- | -- |
| 2024 | $4,116 | $204,200 | -- | -- |
| 2023 | $4,041 | $188,400 | $44,500 | $143,900 |
| 2022 | $3,927 | $183,300 | $0 | $0 |
| 2021 | $4,206 | $178,200 | $0 | $0 |
| 2020 | $3,721 | $173,100 | $44,500 | $128,600 |
| 2019 | $3,702 | $173,100 | $44,500 | $128,600 |
| 2018 | $3,764 | $173,100 | $44,500 | $128,600 |
| 2017 | $4,000 | $182,200 | $0 | $0 |
| 2016 | $3,296 | $176,300 | $0 | $0 |
| 2015 | $3,296 | $170,400 | $0 | $0 |
| 2014 | $3,296 | $164,500 | $0 | $0 |
Source: Public Records
Map
Nearby Homes
Your Personal Tour Guide
Ask me questions while you tour the home.