Estimated Value: $317,000 - $366,000
3
Beds
2
Baths
1,789
Sq Ft
$187/Sq Ft
Est. Value
About This Home
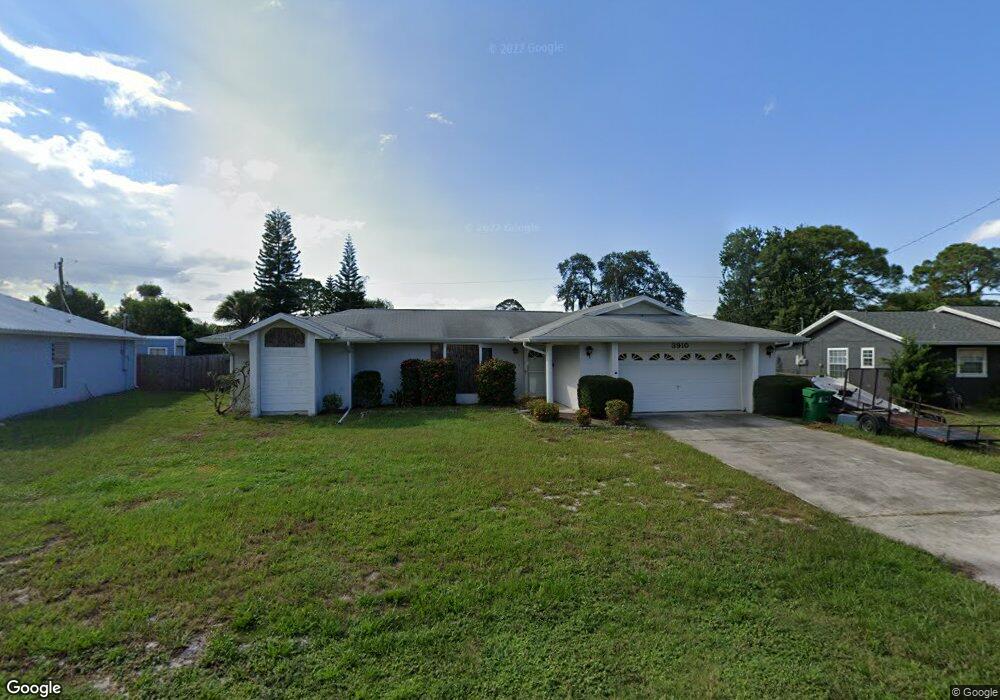
This home is located at 3910 Oakland St, Cocoa, FL 32927 and is currently estimated at $335,361, approximately $187 per square foot. 3910 Oakland St is a home located in Brevard County with nearby schools including Challenger 7 Elementary School, Space Coast Junior/Senior High School, and East Atlantic Prep of Brevard County.
Ownership History
Date
Name
Owned For
Owner Type
Purchase Details
Closed on
Jul 6, 2023
Sold by
Carmack Michael Paul
Bought by
Carmack Michael Paul and Schambers Maria Delray
Current Estimated Value
Purchase Details
Closed on
Sep 29, 2017
Sold by
Ward Carolyn A and Ward Edwin T
Bought by
Carmack Michael P
Home Financials for this Owner
Home Financials are based on the most recent Mortgage that was taken out on this home.
Original Mortgage
$107,600
Interest Rate
3.89%
Purchase Details
Closed on
Aug 3, 2017
Sold by
Myers Rita D and Myers Jack
Bought by
Ward Carolyn A
Home Financials for this Owner
Home Financials are based on the most recent Mortgage that was taken out on this home.
Original Mortgage
$107,600
Interest Rate
3.89%
Purchase Details
Closed on
Apr 21, 2015
Sold by
Ward Carolyn A
Bought by
Ward Carolyn A and Ward Edwin T
Purchase Details
Closed on
Apr 20, 2015
Sold by
Cross Michael A and Cross Joyce
Bought by
Ward Carolyn A
Create a Home Valuation Report for This Property
The Home Valuation Report is an in-depth analysis detailing your home's value as well as a comparison with similar homes in the area
Home Values in the Area
Average Home Value in this Area
Purchase History
| Date | Buyer | Sale Price | Title Company |
|---|---|---|---|
| Carmack Michael Paul | $100 | None Listed On Document | |
| Carmack Michael P | $120,000 | Liberty Title Co | |
| Ward Carolyn A | -- | Liberty Title Co | |
| Ward Carolyn A | -- | Attorney | |
| Ward Carolyn A | -- | Attorney | |
| Ward Carolyn A | -- | Attorney | |
| Ward Carolyn A | -- | Attorney |
Source: Public Records
Mortgage History
| Date | Status | Borrower | Loan Amount |
|---|---|---|---|
| Previous Owner | Carmack Michael P | $107,600 | |
| Previous Owner | Ward Carolyn A | $15,000 |
Source: Public Records
Tax History
| Year | Tax Paid | Tax Assessment Tax Assessment Total Assessment is a certain percentage of the fair market value that is determined by local assessors to be the total taxable value of land and additions on the property. | Land | Improvement |
|---|---|---|---|---|
| 2025 | $2,372 | $186,800 | -- | -- |
| 2024 | $2,379 | $181,540 | -- | -- |
| 2023 | $2,379 | $175,160 | -- | -- |
| 2022 | $2,226 | $170,060 | $0 | $0 |
| 2021 | $2,265 | $165,110 | $0 | $0 |
| 2020 | $2,214 | $162,840 | $0 | $0 |
| 2019 | $2,159 | $159,180 | $0 | $0 |
| 2018 | $2,163 | $156,220 | $27,000 | $129,220 |
| 2017 | $2,546 | $139,070 | $24,000 | $115,070 |
| 2016 | $2,390 | $119,340 | $18,000 | $101,340 |
| 2015 | $2,273 | $108,010 | $15,000 | $93,010 |
| 2014 | $1,079 | $76,000 | $11,000 | $65,000 |
Source: Public Records
Map
Nearby Homes
- 3915 Fay Blvd
- 3875 Fay Blvd
- 3925 Newport St
- 3965 Oakland St
- 6405 Lookout Dr
- 6455 Orchid Ave
- 4016 Song Dr
- 0 Fay Blvd Unit 1011912
- 6560 Miraflores Ave
- 780 Alcazar Ave
- 520 Arabella Ln
- 6275 Marcy St
- 961 Kaufman St
- 4300 Fay Blvd
- 925 MacCo Rd
- 4240 Ponds Dr
- 1131 Covina St
- 414 Oakridge Ave
- 645 Altura Dr
- 4330 Fairfax St
- 3900 Oakland St
- 3920 Oakland St
- 3925 Scotland St
- 3945 Scotland St
- 3915 Scotland St
- 3890 Oakland St
- 3895 Oakland St
- 3930 Oakland St
- 3955 Scotland St
- 3885 Scotland St
- 3905 Oakland St
- 3885 Oakland St
- 3961 Scotland St
- 3880 Oakland St
- 3875 Scotland St
- 3915 Oakland St
- 3875 Oakland St
- 3930 Scotland St
- 3940 Oakland St
- 3900 Newport St
Your Personal Tour Guide
Ask me questions while you tour the home.