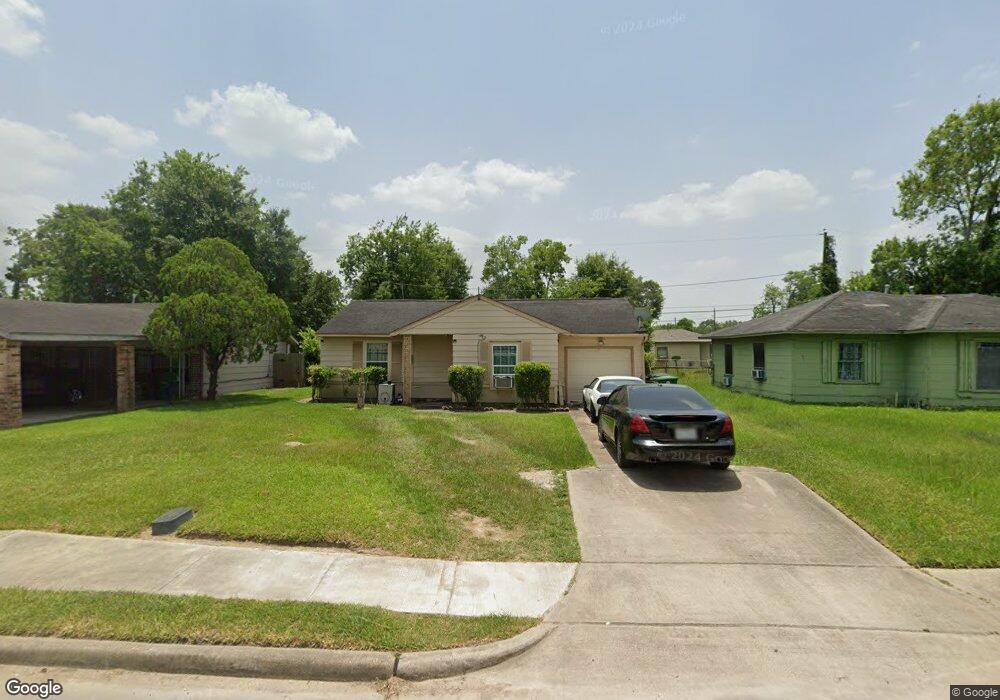
3910 Porter St Houston, TX 77021
OST-South Union NeighborhoodEstimated Value: $121,000 - $174,000
2
Beds
1
Bath
824
Sq Ft
$178/Sq Ft
Est. Value
About This Home
This home is located at 3910 Porter St, Houston, TX 77021 and is currently estimated at $147,019, approximately $178 per square foot. 3910 Porter St is a home located in Harris County with nearby schools including Peck Elementary School, Cullen Middle School, and Yates High School.
Ownership History
Date
Name
Owned For
Owner Type
Purchase Details
Closed on
Oct 29, 2010
Sold by
Williams James W and Williams Dorothy L
Bought by
Hodge Walthou
Current Estimated Value
Home Financials for this Owner
Home Financials are based on the most recent Mortgage that was taken out on this home.
Original Mortgage
$56,529
Outstanding Balance
$38,199
Interest Rate
4.75%
Mortgage Type
FHA
Estimated Equity
$108,820
Purchase Details
Closed on
Nov 28, 2007
Sold by
Green Michael
Bought by
Williams James W and Williams Dorothy L
Home Financials for this Owner
Home Financials are based on the most recent Mortgage that was taken out on this home.
Original Mortgage
$53,550
Interest Rate
6.43%
Mortgage Type
Purchase Money Mortgage
Purchase Details
Closed on
Jan 10, 2007
Sold by
Smith Retha
Bought by
Green Michael
Create a Home Valuation Report for This Property
The Home Valuation Report is an in-depth analysis detailing your home's value as well as a comparison with similar homes in the area
Home Values in the Area
Average Home Value in this Area
Purchase History
| Date | Buyer | Sale Price | Title Company |
|---|---|---|---|
| Hodge Walthou | -- | Stewart Title Brazoria | |
| Williams James W | -- | Stewart Title Brazoria | |
| Green Michael | -- | Title Stream |
Source: Public Records
Mortgage History
| Date | Status | Borrower | Loan Amount |
|---|---|---|---|
| Open | Hodge Walthou | $56,529 | |
| Previous Owner | Williams James W | $53,550 | |
| Closed | Green Michael | $0 |
Source: Public Records
Tax History Compared to Growth
Tax History
| Year | Tax Paid | Tax Assessment Tax Assessment Total Assessment is a certain percentage of the fair market value that is determined by local assessors to be the total taxable value of land and additions on the property. | Land | Improvement |
|---|---|---|---|---|
| 2025 | $904 | $150,767 | $100,350 | $50,417 |
| 2024 | $904 | $161,269 | $100,350 | $60,919 |
| 2023 | $904 | $157,067 | $100,350 | $56,717 |
| 2022 | $1,675 | $135,000 | $78,050 | $56,950 |
| 2021 | $1,612 | $107,316 | $50,175 | $57,141 |
| 2020 | $1,523 | $86,868 | $33,450 | $53,418 |
| 2019 | $1,447 | $73,167 | $27,875 | $45,292 |
| 2018 | $756 | $61,997 | $22,300 | $39,697 |
| 2017 | $1,195 | $61,997 | $22,300 | $39,697 |
| 2016 | $1,086 | $53,760 | $22,300 | $31,460 |
| 2015 | $553 | $51,408 | $22,300 | $29,108 |
| 2014 | $553 | $35,498 | $13,938 | $21,560 |
Source: Public Records
Map
Nearby Homes
- 3939 Tristan St
- 3931 Zephyr St
- 3922 Alsace St
- 5908 Saint Augustine St Unit B
- 5908 Saint Augustine St Unit C
- 6202 Conley St
- 5920 Conley St
- 3719 Zephyr St
- 0 Conley St
- 3714 Odin Ct
- 3806 Cosby St
- 6019 England St
- 4209 Short St
- 4013 Griggs Rd Unit E
- 4013 Griggs Rd Unit D
- 3627 Zephyr St
- 3902 Charleston St
- 6208 Sidney St
- 6135 Sidney St
- 6417 Saint Augustine St