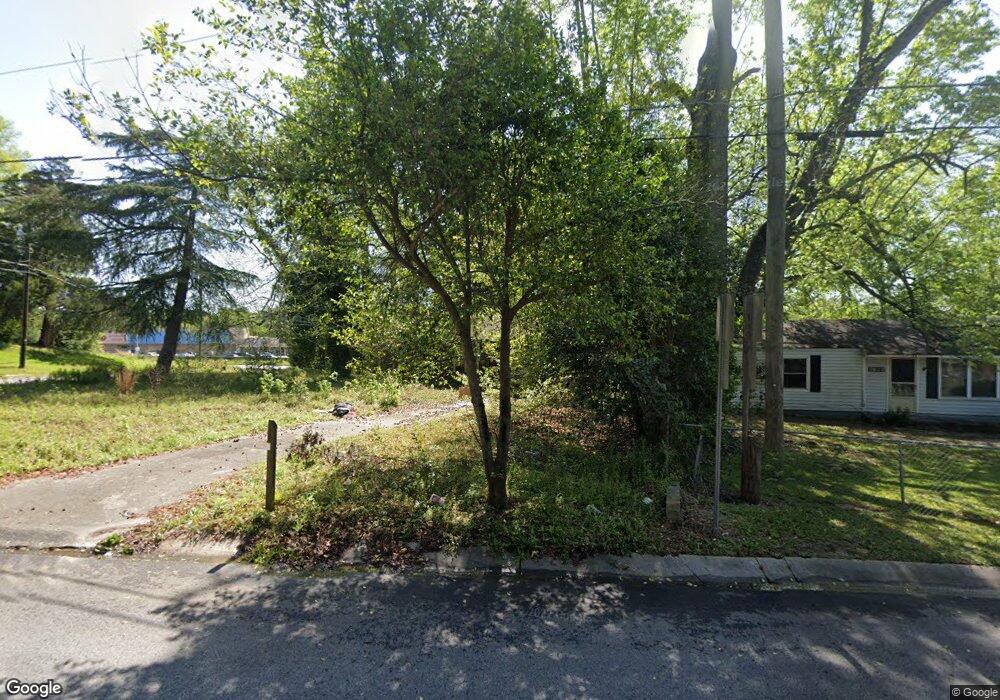
3910 St Charles Place Macon, GA 31206
Estimated Value: $18,000 - $57,000
2
Beds
1
Bath
928
Sq Ft
$43/Sq Ft
Est. Value
About This Home
This home is located at 3910 St Charles Place, Macon, GA 31206 and is currently estimated at $39,506, approximately $42 per square foot. 3910 St Charles Place is a home located in Bibb County with nearby schools including Southfield Elementary School, Southwest High School, and Cirrus Charter Academy.
Ownership History
Date
Name
Owned For
Owner Type
Purchase Details
Closed on
Jul 11, 2025
Sold by
Bowerman Llc
Bought by
Dukes Everett
Current Estimated Value
Purchase Details
Closed on
May 5, 2025
Sold by
Lunsford Family Properties Llc
Bought by
Bowerman Llc
Purchase Details
Closed on
May 4, 2022
Sold by
South Street Llc
Bought by
Lunsford Family Properties Llc
Home Financials for this Owner
Home Financials are based on the most recent Mortgage that was taken out on this home.
Original Mortgage
$1,000,000
Interest Rate
4.4%
Mortgage Type
Construction
Purchase Details
Closed on
May 10, 2013
Sold by
Jlb Properties Llc
Bought by
Srof Llc
Purchase Details
Closed on
May 9, 2013
Sold by
Coleman Properties Inc
Bought by
Zz Properties Llc
Purchase Details
Closed on
Jul 14, 2010
Sold by
Capital City Bank
Bought by
Zz Properties Llc
Purchase Details
Closed on
May 14, 2010
Sold by
Boyd Suzanne M
Bought by
Capital City Bank
Purchase Details
Closed on
Feb 7, 2000
Bought by
Boyd Suzanne M
Create a Home Valuation Report for This Property
The Home Valuation Report is an in-depth analysis detailing your home's value as well as a comparison with similar homes in the area
Home Values in the Area
Average Home Value in this Area
Purchase History
| Date | Buyer | Sale Price | Title Company |
|---|---|---|---|
| Dukes Everett | $17,500 | None Listed On Document | |
| Bowerman Llc | -- | None Listed On Document | |
| Lunsford Family Properties Llc | $920,000 | None Listed On Document | |
| Srof Llc | $23,000 | None Available | |
| Zz Properties Llc | -- | None Available | |
| Jlb Properties Llc | $160,000 | -- | |
| Zz Properties Llc | $7,975 | None Available | |
| Capital City Bank | -- | -- | |
| Boyd Suzanne M | $32,000 | -- |
Source: Public Records
Mortgage History
| Date | Status | Borrower | Loan Amount |
|---|---|---|---|
| Previous Owner | Lunsford Family Properties Llc | $1,000,000 |
Source: Public Records
Tax History Compared to Growth
Tax History
| Year | Tax Paid | Tax Assessment Tax Assessment Total Assessment is a certain percentage of the fair market value that is determined by local assessors to be the total taxable value of land and additions on the property. | Land | Improvement |
|---|---|---|---|---|
| 2025 | $387 | $15,751 | $2,400 | $13,351 |
| 2024 | $400 | $15,751 | $2,400 | $13,351 |
| 2023 | $401 | $13,543 | $1,728 | $11,815 |
| 2022 | $1,431 | $10,077 | $1,456 | $8,621 |
| 2021 | $312 | $8,218 | $1,456 | $6,762 |
| 2020 | $264 | $6,790 | $874 | $5,916 |
| 2019 | $233 | $5,945 | $874 | $5,071 |
| 2018 | $486 | $5,100 | $874 | $4,226 |
| 2017 | $190 | $5,080 | $874 | $4,206 |
| 2016 | $161 | $4,658 | $874 | $3,785 |
| 2015 | $290 | $5,920 | $874 | $5,047 |
| 2014 | $347 | $6,166 | $1,456 | $4,710 |
Source: Public Records
Map
Nearby Homes
- 3905 Saint Charles Place
- 3874 Saint Charles Place
- 3982 Saint Charles Place
- 3819 Frances Dr
- 4077 Saint Charles Place
- 3751 Travis Blvd
- 1388 Lakeview Cir
- 3778 Spencer Cir
- 1359 Hillridge Dr
- 1325 Triple Hill Dr
- 3935 Travis Blvd
- 1559 Rocky Creek Rd
- 3881 Spencer Cir
- 3391 Pio Nono Cir
- 4071 Marse Allen Rd
- 4142 Buena Vista Ave
- 3922 Saint Charles Place
- 3905 Saint Charles St
- 3934 Saint Charles Place
- 3896 Saint Charles Place
- 3895 Saint Charles Place
- 3945 St Charles Place
- 3945 Saint Charles Place
- 0 Saint Charles Place
- 3946 Saint Charles Place
- 3946 St Charles Place
- 3875 Rice Mill Rd
- 3882 Saint Charles Place
- 3887 Saint Charles Place
- 3940 Tyler Dr
- 3958 Saint Charles Place
- 3867 Rice Mill Rd
- 3934 Tyler Dr
- 3959 Saint Charles Place
- 3879 Saint Charles Place
- 3859 Rice Mill Rd