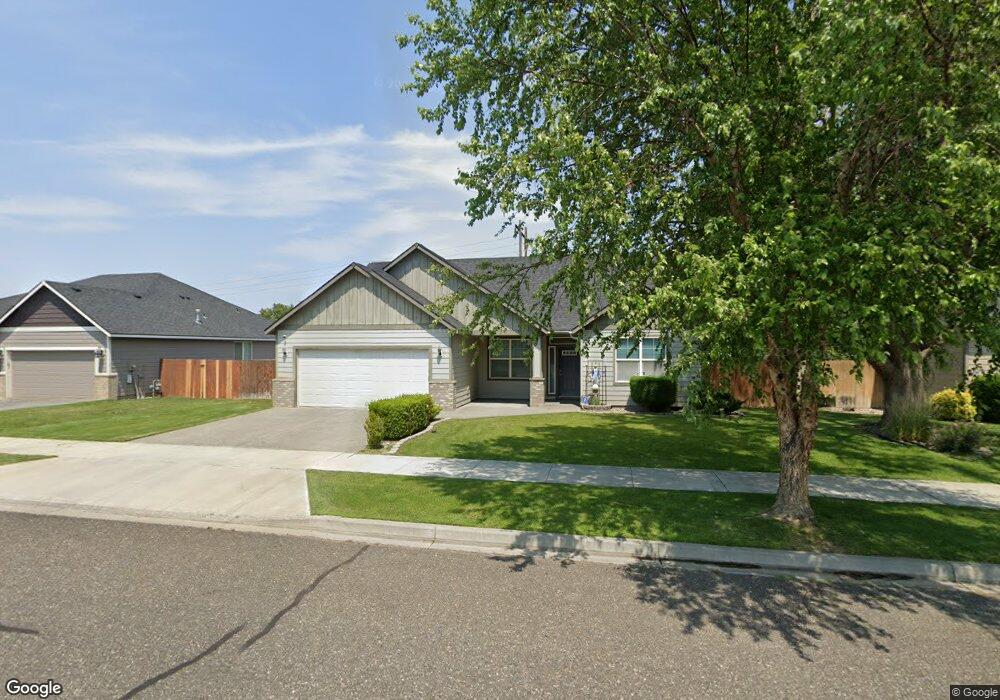
3910 W 20th Ave Kennewick, WA 99338
Estimated Value: $429,000 - $464,000
4
Beds
2
Baths
1,701
Sq Ft
$258/Sq Ft
Est. Value
About This Home
This home is located at 3910 W 20th Ave, Kennewick, WA 99338 and is currently estimated at $439,440, approximately $258 per square foot. 3910 W 20th Ave is a home located in Benton County with nearby schools including Lincoln Elementary School, Southridge High School, and Bethlehem Lutheran School.
Ownership History
Date
Name
Owned For
Owner Type
Purchase Details
Closed on
Mar 19, 2013
Sold by
Pham Cong
Bought by
Pham Cong T and Pham Van T
Current Estimated Value
Purchase Details
Closed on
Jan 26, 2006
Sold by
Jls Custom Homes Inc
Bought by
Pham Cong
Home Financials for this Owner
Home Financials are based on the most recent Mortgage that was taken out on this home.
Original Mortgage
$163,400
Interest Rate
6.28%
Mortgage Type
Fannie Mae Freddie Mac
Purchase Details
Closed on
Feb 16, 2005
Sold by
Kennewick Properties Llc
Bought by
Jls Custom Homes Inc
Home Financials for this Owner
Home Financials are based on the most recent Mortgage that was taken out on this home.
Original Mortgage
$3,573,720
Interest Rate
6.5%
Mortgage Type
Fannie Mae Freddie Mac
Create a Home Valuation Report for This Property
The Home Valuation Report is an in-depth analysis detailing your home's value as well as a comparison with similar homes in the area
Home Values in the Area
Average Home Value in this Area
Purchase History
| Date | Buyer | Sale Price | Title Company |
|---|---|---|---|
| Pham Cong T | -- | None Available | |
| Pham Cong | $172,000 | Chicago Title | |
| Jls Custom Homes Inc | $800,000 | Chicago Title |
Source: Public Records
Mortgage History
| Date | Status | Borrower | Loan Amount |
|---|---|---|---|
| Previous Owner | Pham Cong | $163,400 | |
| Previous Owner | Jls Custom Homes Inc | $3,573,720 |
Source: Public Records
Tax History Compared to Growth
Tax History
| Year | Tax Paid | Tax Assessment Tax Assessment Total Assessment is a certain percentage of the fair market value that is determined by local assessors to be the total taxable value of land and additions on the property. | Land | Improvement |
|---|---|---|---|---|
| 2024 | $3,210 | $421,770 | $70,000 | $351,770 |
| 2023 | $3,210 | $401,670 | $70,000 | $331,670 |
| 2022 | $2,749 | $311,210 | $70,000 | $241,210 |
| 2021 | $2,549 | $281,060 | $70,000 | $211,060 |
| 2020 | $2,516 | $252,570 | $42,000 | $210,570 |
| 2019 | $2,174 | $238,530 | $42,000 | $196,530 |
| 2018 | $2,301 | $210,460 | $42,000 | $168,460 |
| 2017 | $2,110 | $182,380 | $42,000 | $140,380 |
| 2016 | $2,539 | $182,380 | $42,000 | $140,380 |
| 2015 | $2,507 | $182,380 | $42,000 | $140,380 |
| 2014 | -- | $179,150 | $42,000 | $137,150 |
| 2013 | -- | $179,150 | $42,000 | $137,150 |
Source: Public Records
Map
Nearby Homes
- Lot 18, Phase 8 W 21st Ave Unit Lot18
- Lot 16, Phase 8 W 21st Ave Unit Lot16
- Lot 19, Phase 8 W 21st Ave Unit Lot19
- Lot 20, Phase 8 W 21st Ave Unit Lot20
- 3701 W 20th Ave
- 2015 S Sheppard St
- 2017 S Sheppard Place
- 6910 W 22nd Ave
- 2017 S Tweedt St
- 1513 S Reed Ct
- 4218 W 19th Ave
- 4311 W 22nd Ave
- 1839 S Union St
- 1821 S Union St
- 4175 W 24th Ave
- 2602 S Union St
- 3324 W 19th Ave Unit 186
- 3324 W 19th Ave Unit 111
- 3324 W 19th Ave Unit 14
- 3324 W 19th Ave Unit 57
- 3906 W 20th Ave
- 4000 W 20th Ave
- 4004 W 20th Ave
- 3911 W 20th Ave
- 3902 W 20th Ave
- 4001 W 20th Ave
- 3907 W 20th Ave Unit 1
- 3907 W 20th Ave Unit New FULL FENCING BEI
- 3907 W 20th Ave Unit Beautiful 2-Story Ho
- 3913 W 19th Ct
- 3909 W 19th Ct
- 4005 W 20th Ave
- 3905 W 19th Ct
- 3903 W 20th Ave
- 4008 W 20th Ave
- 4003 W 19th Ct
- 3910 W 21st Ave
- 1906 S Perry St
- 4009 W 20th Ave
- 3906 W 21st Ave