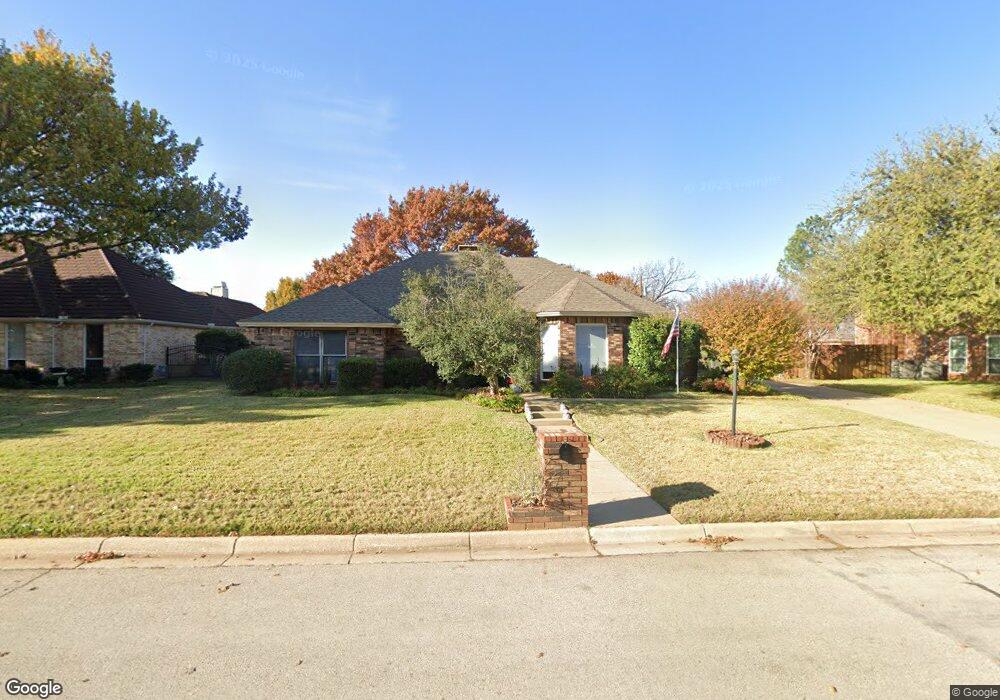
3910 Windview Dr Colleyville, TX 76034
Estimated Value: $498,948 - $656,000
3
Beds
2
Baths
2,427
Sq Ft
$237/Sq Ft
Est. Value
About This Home
This home is located at 3910 Windview Dr, Colleyville, TX 76034 and is currently estimated at $573,987, approximately $236 per square foot. 3910 Windview Dr is a home located in Tarrant County with nearby schools including Bransford Elementary School, Colleyville Middle School, and Covenant Christian Academy.
Ownership History
Date
Name
Owned For
Owner Type
Purchase Details
Closed on
Aug 30, 2011
Sold by
Romack Art and Romack Cathy
Bought by
Pevoto John and Pevoto Katherine
Current Estimated Value
Home Financials for this Owner
Home Financials are based on the most recent Mortgage that was taken out on this home.
Original Mortgage
$180,000
Outstanding Balance
$124,841
Interest Rate
4.53%
Mortgage Type
New Conventional
Estimated Equity
$449,146
Purchase Details
Closed on
Feb 12, 1997
Sold by
Proctor Danny R and Proctor Shirley A
Bought by
Miga Daniel E and Miga Rhonda A
Home Financials for this Owner
Home Financials are based on the most recent Mortgage that was taken out on this home.
Original Mortgage
$169,847
Interest Rate
7.92%
Mortgage Type
VA
Purchase Details
Closed on
May 23, 1994
Sold by
Home Svgs Of America Fsb
Bought by
Proctor Danny R and Proctor Shirley A
Home Financials for this Owner
Home Financials are based on the most recent Mortgage that was taken out on this home.
Original Mortgage
$106,400
Interest Rate
8.19%
Mortgage Type
Seller Take Back
Purchase Details
Closed on
Mar 3, 1994
Sold by
Fuentes Gina Detrie
Bought by
Hsa
Create a Home Valuation Report for This Property
The Home Valuation Report is an in-depth analysis detailing your home's value as well as a comparison with similar homes in the area
Home Values in the Area
Average Home Value in this Area
Purchase History
| Date | Buyer | Sale Price | Title Company |
|---|---|---|---|
| Pevoto John | $223,484 | None Available | |
| Miga Daniel E | -- | Trinity Western Title Co | |
| Proctor Danny R | -- | Chicago Title Insurance Co | |
| Hsa | -- | -- |
Source: Public Records
Mortgage History
| Date | Status | Borrower | Loan Amount |
|---|---|---|---|
| Open | Pevoto John | $180,000 | |
| Previous Owner | Miga Daniel E | $169,847 | |
| Previous Owner | Proctor Danny R | $106,400 | |
| Closed | Proctor Danny R | $13,300 |
Source: Public Records
Tax History Compared to Growth
Tax History
| Year | Tax Paid | Tax Assessment Tax Assessment Total Assessment is a certain percentage of the fair market value that is determined by local assessors to be the total taxable value of land and additions on the property. | Land | Improvement |
|---|---|---|---|---|
| 2025 | $1,506 | $436,735 | $125,050 | $311,685 |
| 2024 | $1,506 | $436,735 | $125,050 | $311,685 |
| 2023 | $7,411 | $439,311 | $125,050 | $314,261 |
| 2022 | $8,056 | $428,785 | $125,050 | $303,735 |
| 2021 | $8,143 | $381,235 | $75,030 | $306,205 |
| 2020 | $7,491 | $337,103 | $75,030 | $262,073 |
| 2019 | $8,233 | $356,116 | $100,000 | $256,116 |
| 2018 | $1,935 | $325,407 | $100,000 | $225,407 |
| 2017 | $7,098 | $336,509 | $120,000 | $216,509 |
| 2016 | $6,453 | $298,654 | $80,000 | $218,654 |
| 2015 | $5,556 | $248,300 | $35,000 | $213,300 |
| 2014 | $5,556 | $248,300 | $35,000 | $213,300 |
Source: Public Records
Map
Nearby Homes
- 2204 Woodstock Dr
- 3907 Windermere Dr
- 3813 Brookridge Ct
- 2001 Oak Knoll Dr
- Seaberry II Plan at Grace Park - Signature Series
- Primrose FE V Plan at Grace Park - Signature Series
- Hawthorne Plan at Grace Park - Signature Series
- Seaberry Plan at Grace Park - Signature Series
- Gardenia Plan at Grace Park - Signature Series
- Bellflower IV Plan at Grace Park - Signature Series
- Bellflower II Plan at Grace Park - Signature Series
- Carolina IV Plan at Grace Park - Signature Series
- Carolina Plan at Grace Park - Signature Series
- Violet III Plan at Grace Park - Signature Series
- Violet IV Plan at Grace Park - Signature Series
- Magnolia III Plan at Grace Park - Signature Series
- Violet II Plan at Grace Park - Signature Series
- Rose II Plan at Grace Park - Signature Series
- Magnolia II Plan at Grace Park - Signature Series
- Magnolia Plan at Grace Park - Signature Series
- 3912 Windview Dr
- 3908 Windview Dr
- 3909 Ambleside Dr
- 3911 Ambleside Dr
- 3914 Windview Dr
- 3913 Windview Dr
- 3911 Windview Dr
- 3906 Windview Dr
- 3907 Ambleside Dr
- 3913 Ambleside Dr
- 3915 Windview Dr
- 3909 Windview Dr
- 3916 Windview Dr
- 4001 Windview Dr
- 2200 Woodstock Dr
- 4001 Ambleside Dr
- 3910 Ambleside Dr
- 3912 Stonehaven Dr
- 3912 Ambleside Dr
- 3910 Stonehaven Dr