
Seller's Agent in 2025
Demetri Georgakopoulos
Windermere Corporate
(206) 409-7275
1 in this area
45 Total Sales

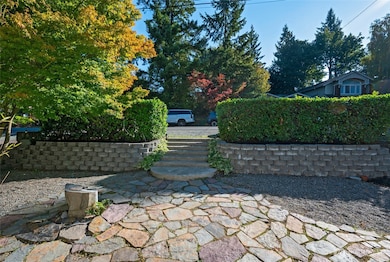
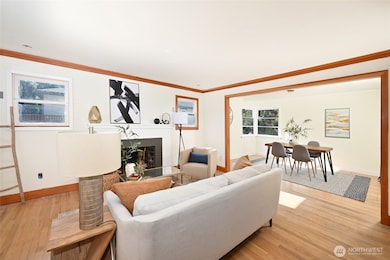
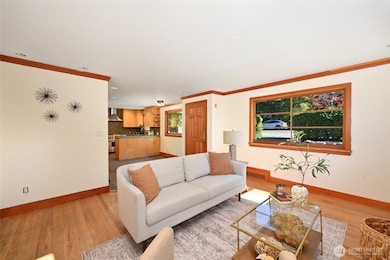

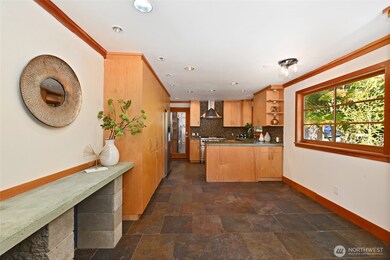
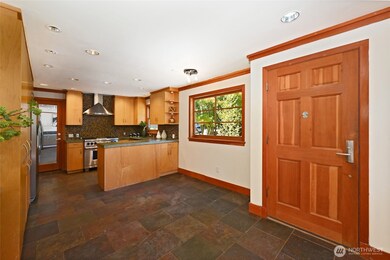
Embrace the Mercer Island lifestyle in one of the region’s most desirable communities. This charming mid-century home offers a blank canvas ready for your creative vision. The captivating backyard—one of the area’s finest—provides endless possibilities: build a DADU, expand the existing home, or reimagine the space entirely. Step into your own whimsical retreat where inspiration awaits at every turn. The inviting curb appeal and front yard create the perfect setting for entertaining and savoring island living. You’ll be just minutes from the local swimming pool, I90, and the High School, with all that Mercer Island offers at your fingertips. The downtown shopping district, with every amenity you need, is a short drive or pleasant walk away.
Last Agent to Sell the Property
Windermere Real Estate Co. License #116260 Listed on: 09/19/2025
Source: Northwest Multiple Listing Service (NWMLS)
MLS#: 2434125
| Date | Type | Sale Price | Title Company |
|---|---|---|---|
| Warranty Deed | $1,375,000 | Ticor Title | |
| Warranty Deed | $225,000 | Chicago Title Insurance Co | |
| Warranty Deed | -- | -- | |
| Warranty Deed | $155,000 | Evergreen Title Co | |
| Warranty Deed | -- | -- |
| Date | Status | Loan Amount | Loan Type |
|---|---|---|---|
| Previous Owner | $120,000 | No Value Available | |
| Previous Owner | $124,000 | No Value Available |
| Date | Event | Price | List to Sale | Price per Sq Ft |
|---|---|---|---|---|
| 10/29/2025 10/29/25 | Sold | $1,375,000 | +1.9% | $781 / Sq Ft |
| 10/19/2025 10/19/25 | Pending | -- | -- | -- |
| 09/19/2025 09/19/25 | For Sale | $1,350,000 | -- | $767 / Sq Ft |
| Year | Tax Paid | Tax Assessment Tax Assessment Total Assessment is a certain percentage of the fair market value that is determined by local assessors to be the total taxable value of land and additions on the property. | Land | Improvement |
|---|---|---|---|---|
| 2024 | $926 | $1,429,000 | $1,154,000 | $275,000 |
| 2023 | $971 | $1,342,000 | $1,089,000 | $253,000 |
| 2022 | $1,150 | $1,501,000 | $1,225,000 | $276,000 |
| 2021 | $1,242 | $1,122,000 | $1,009,000 | $113,000 |
| 2020 | $5,598 | $991,000 | $961,000 | $30,000 |
| 2018 | $5,467 | $694,000 | $684,000 | $10,000 |
| 2017 | $4,698 | $629,000 | $619,000 | $10,000 |
| 2016 | $4,381 | $576,000 | $566,000 | $10,000 |
| 2015 | $4,252 | $523,000 | $513,000 | $10,000 |
| 2014 | -- | $485,000 | $475,000 | $10,000 |
| 2013 | -- | $449,000 | $448,000 | $1,000 |
Seller's Agent in 2025
Demetri Georgakopoulos
Windermere Corporate
(206) 409-7275
1 in this area
45 Total Sales
Buyer's Agent in 2025
Ben Hoefer
John L Scott
(206) 992-2504
1 in this area
108 Total Sales
Source: Northwest Multiple Listing Service (NWMLS)
MLS Number: 2434125
APN: 502190-0200
Disclaimer: Certain information contained herein is derived from information provided by parties other than Homes.com. All information provided is deemed reliable, but is not guaranteed to be accurate and should be independently verified.
![]() All data is obtained from various sources and may not have been verified by broker or MLS GRID. Supplied Open House Information is subject to change without notice. All information should be independently reviewed and verified for accuracy. Properties may or may not be listed by the office/agent presenting the information. Listing information is provided by the Northwest Multiple Listing Service (NWMLS). Property information is based on available data that may include MLS information, county records, and other sources. Listings marked with the 3 tree icon and provided by NWMLS. All properties are subject to prior sale or withdrawal. IDX information is provided exclusively for consumers’ personal noncommercial use, that it may not be used for any purpose other than to identify prospective properties consumers may be interested in purchasing, that the data is deemed reliable but is not guaranteed by MLS GRID. ©2025 NWMLS.
All data is obtained from various sources and may not have been verified by broker or MLS GRID. Supplied Open House Information is subject to change without notice. All information should be independently reviewed and verified for accuracy. Properties may or may not be listed by the office/agent presenting the information. Listing information is provided by the Northwest Multiple Listing Service (NWMLS). Property information is based on available data that may include MLS information, county records, and other sources. Listings marked with the 3 tree icon and provided by NWMLS. All properties are subject to prior sale or withdrawal. IDX information is provided exclusively for consumers’ personal noncommercial use, that it may not be used for any purpose other than to identify prospective properties consumers may be interested in purchasing, that the data is deemed reliable but is not guaranteed by MLS GRID. ©2025 NWMLS.
Based on information submitted to the MLS GRID